¶ About This Manual
Welcome to Revopoint Measurement Software User Manual! This manual provides operational guidelines and instructions for the Revo Measure software. You can quickly jump to the corresponding section by clicking any title in the navigation bar.
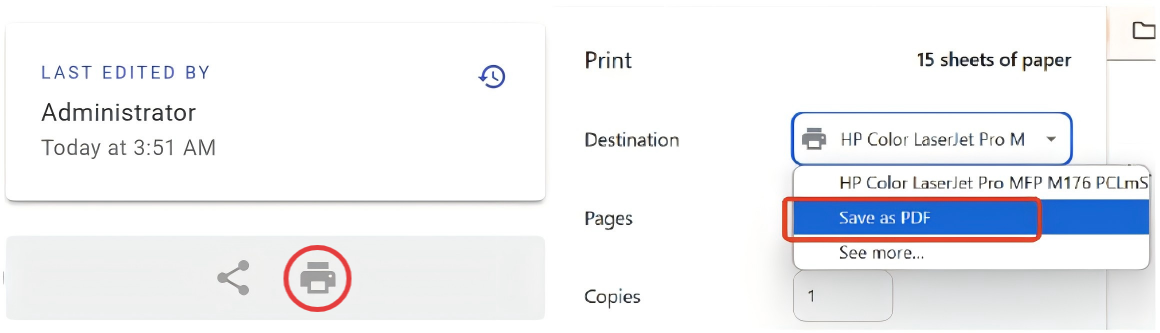
Manual Download
If you need a PDF manual, click the Print Format button at the bottom of the navigation bar on the left side of the manual, and select "Save as PDF" from the options.
Note: The software will be continuously updated. The content of this manual and specific operations are for reference only. Please refer to the actual software interface for details.
¶ Software Activation
¶ Trial Software Activation (Online Only)
① Visit Revopoint's official website and go to "Support – Download" to download the Revo Measure software.
② Open the software. In the activation pop-up window, click "Go to official website" to enter the Revo Measure software page and apply for a trial.
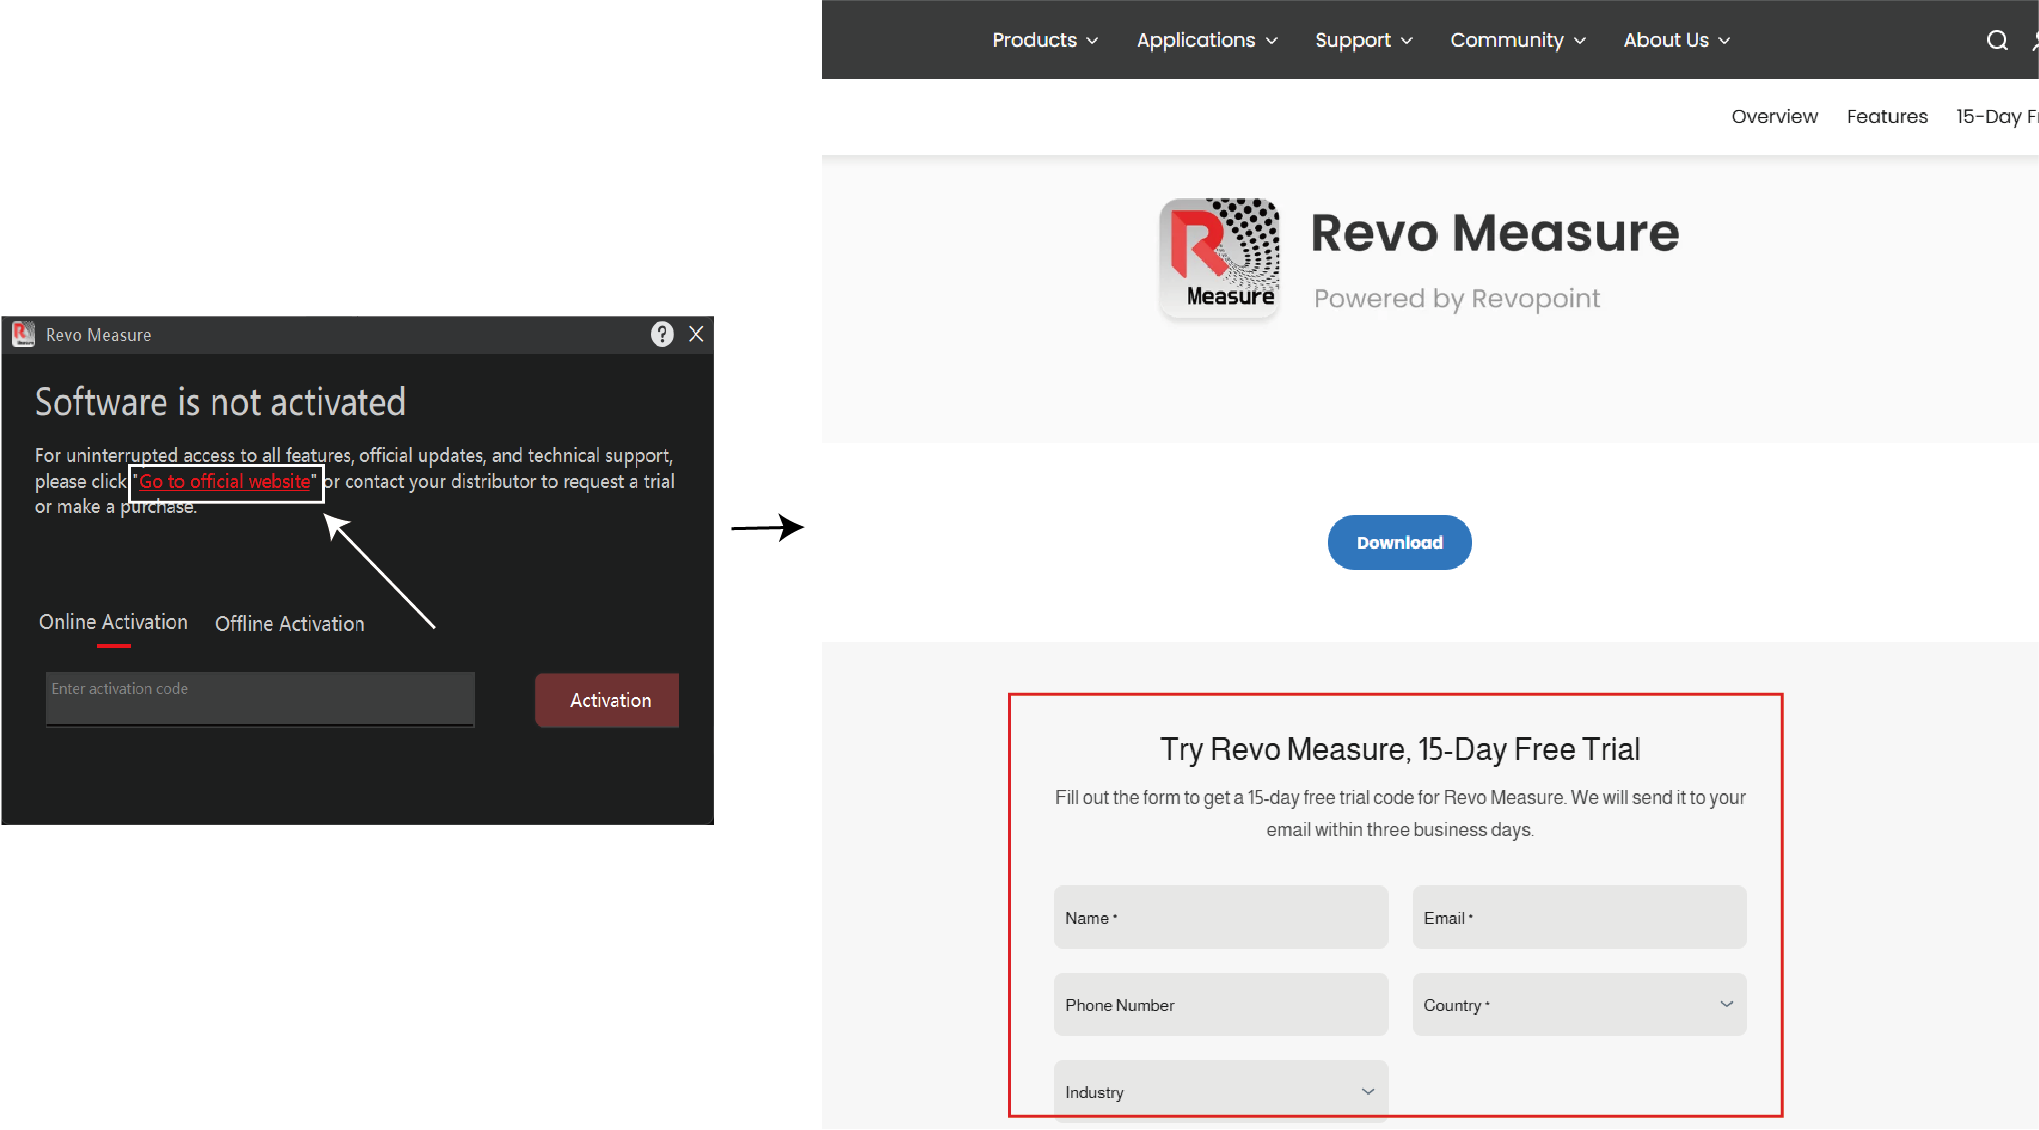
③ The trial license code will be sent to the email address you provided when applying for a trial.
¶ Purchased Software Activation
¶ Online Activation (*Recommended)
① Obtain the Activation Code
- Purchase from Revopoint official website The activation code will be sent to the email address provided when you take an order.
- Purchase from third-party channels (e.g., Amazon) Go to Revopoint official website to download the Revo Measure software. Open the software, click "Click Here" in the pop-up window. Enter the required information and the activation code will be be sent to your registered email.
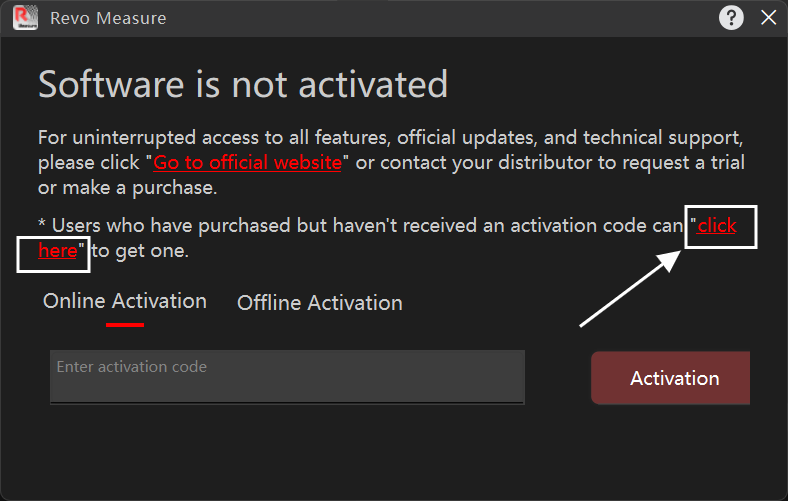
Note: One activation code can only be bound to one single computer. If you don't receive the activation code, please contact official customer support for assistance.
② Activate the Software
Open the software.In the activation pop-up window, select "Online Activation." Ensure the network connection is stable, enter the activation code, and click "Activate."
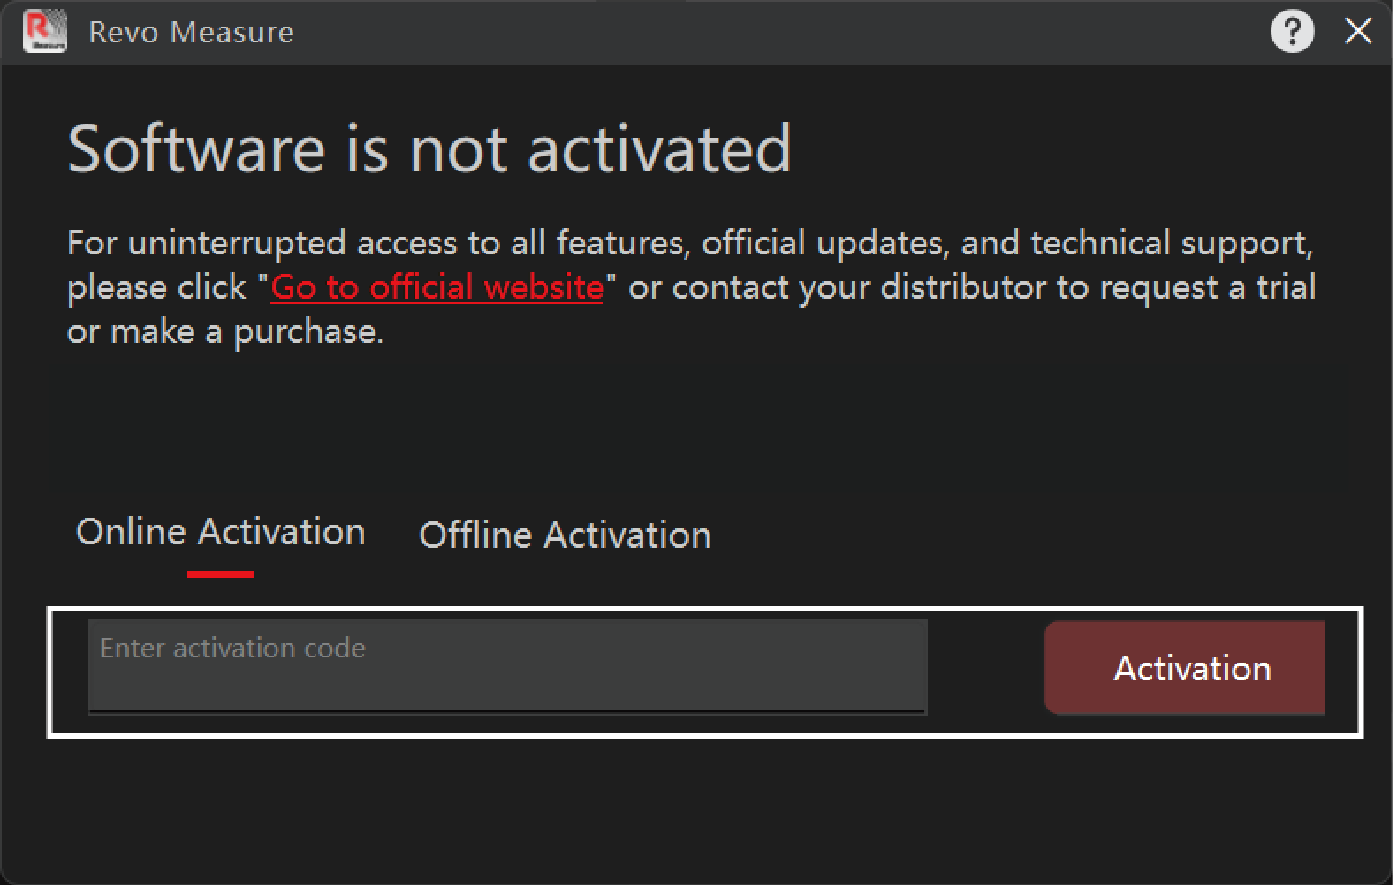
Note: If the activation fails, please contact our official customer support for assistance.
¶ Offline Activation
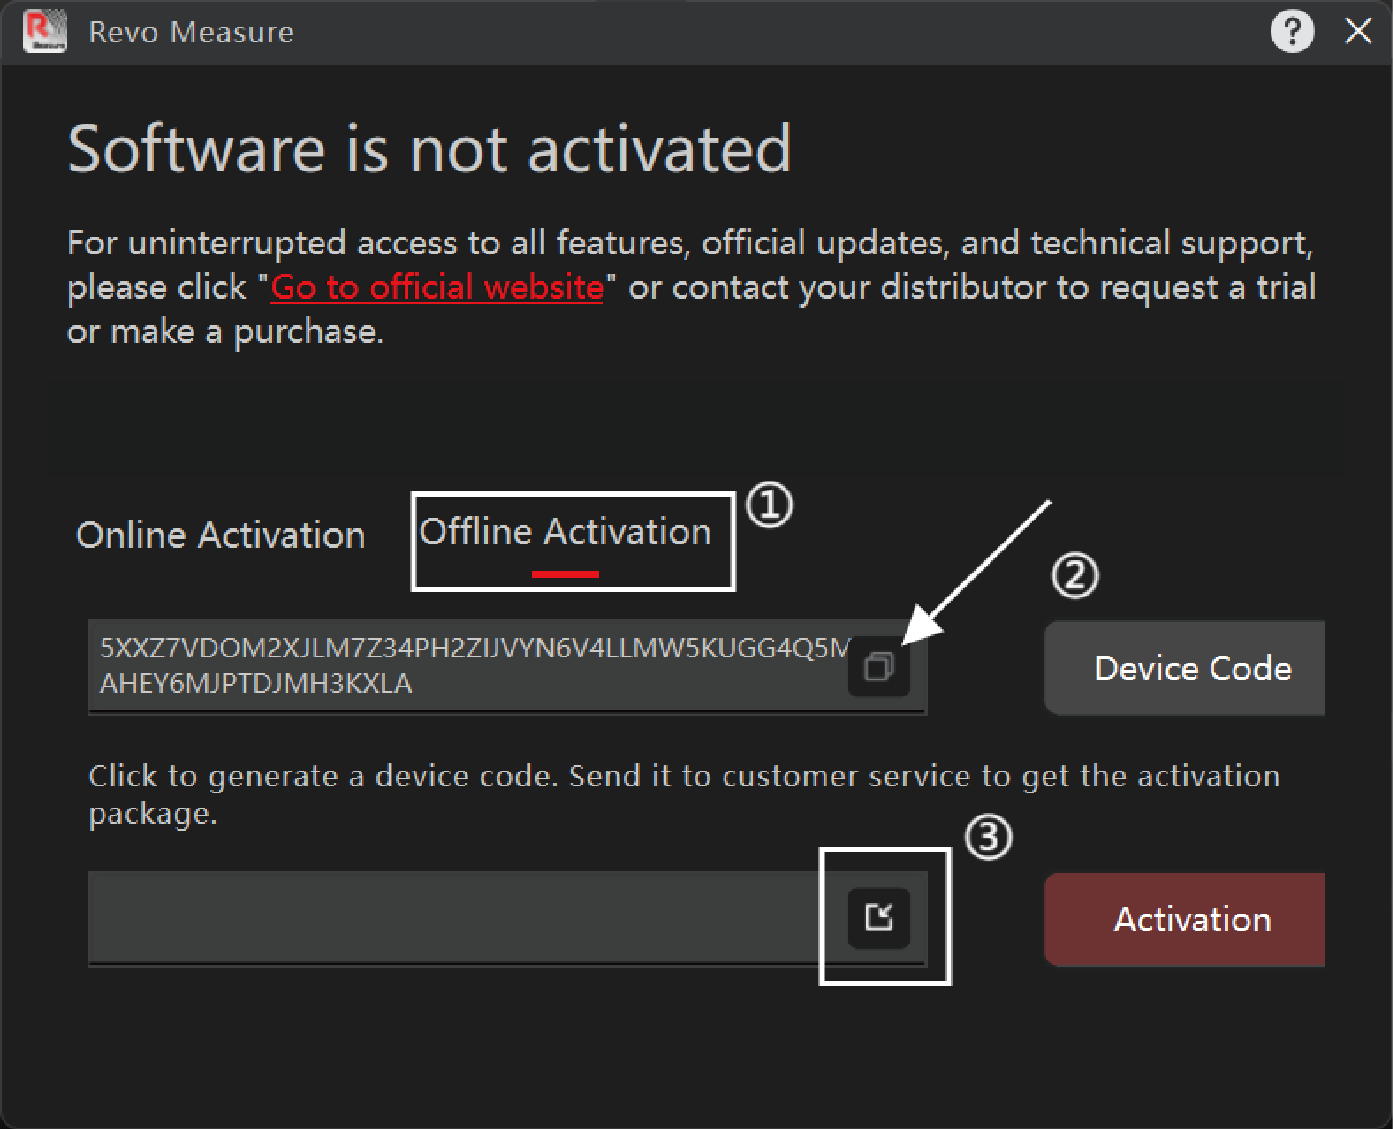
Offline Activation is suitable for situations without internet access or with restricted network connections. Follow the steps below to import the official activation package to activate the software.
① Open the software and select "Offline Activation" in the activation pop-up window.
② Click on "Device Code," copy the generated device code, and send it to our official customer support to obtain the activation package.
③ Download the activation package, click the import icon on the right side of the activation window and import the package, then click "Activate."
Note: If activation fails, please contact our official customer support for assistance.
¶ 1. File
¶ 1.1 Data Import
¶ 1.1.1 New Measurement
Method 1: Click "New Measurement" on the homepage to create a new measurement and enter the measurement interface.
Method 2: When it's required to end the current measurement and create a new project, click "New" in the navigation bar to create a new file for measurement.
¶ 1.1.2 Scan Data Import
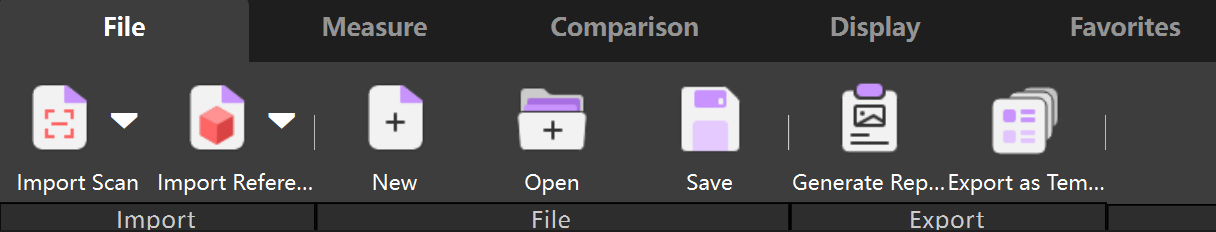
Click "Import Scan" in the navigation bar, select model type in the drop-down menu and import the scan data for measurement.
Supported file formats:
Point Cloud Formats: *.ply, *.pts, *.xyz, *.asc, *.txt, *.csv
When importing text point cloud files in formats such as *.xyz, *.txt, or *.csv, the software will automatically open the pop-up window of "Input Parameters." Click here for details.
Mesh Formats: *.stl, *.obj, *.ply
Note: The current software version supports *.pts file format with the following requirements (continuously optimized in the later versions).
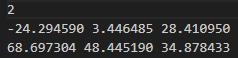
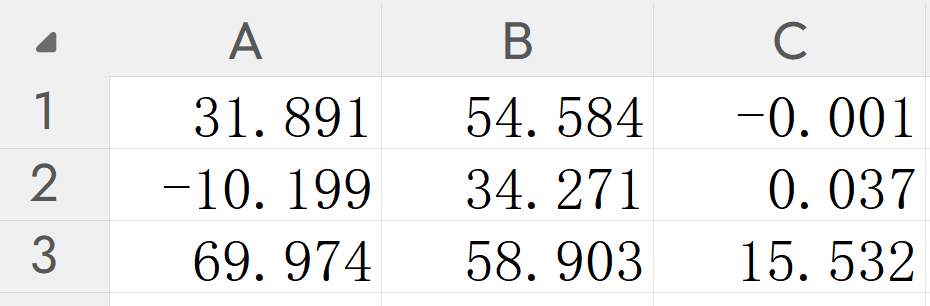
① The file header contains only the total number of points.
② The file consists of either three columns of point cloud data (X, Y, Z), or six columns (X, Y, Z, R, G, B). In the six-column format, the first three columns represent the spatial coordinates of the points and the last three columns represent the RGB color information. For example:
¶ 1.1.3 Reference Data Import
Click "Import Reference" in the navigation bar, select model type in the drop-down menu and import the CAD Model or other reference data for comparison.
Supported File Formats:CAD,Mesh
The formats, version and file extension supported by CAD models are shown in the following table:
| File Extension | Version | Note |
|---|---|---|
| 3MF | 1.2.3 | 3MF |
| IPT | Up to 2026 | Autodesk Inventor |
| IAM | Up to 2026 | Autodesk Inventor |
| CATPart | Up to V5-6R2026 | CATIA V5 |
| CATProduct | Up to V5-6R2026 | CATIA V5 |
| IGS | 5.1, 5.2, 5.3 | IGES |
| IGES | 5.1, 5.2, 5.3 | IGES |
| X_B | Up to 38.1 | Parasolid |
| X_T | Up to 38.1 | Parasolid |
| ASM | 1-20, ST1-ST10, 2019-2026 | Solid Edge |
| PAR | 1-20, ST1-ST10, 2019-2026 | Solid Edge |
| PSM | 1-20, ST1-ST10, 2019-2026 | Solid Edge |
| SLDASM | 97-2026 | SolidWorks |
| SLDPRT | 97-2026 | SolidWorks |
| STP | AP 203 Ed1, Ed2 - AP 214 - AP 242 Ed1, Ed2, Ed3 | STEP |
| STEP | AP 203 Ed1, Ed2 - AP 214 - AP 242 Ed1, Ed2, Ed3 | STEP |
Mesh Formats: *.stl, *.obj, *.ply, *.3mf
¶ 1.1.4 Reference Data Replacement
Reclick "Import Reference" and a pop-up window titled "Replace Reference Data" will appear. Select “Ok” to replace the reference data.
¶ 1.2 Project Operation
¶ 1.2.1 Open a Project
Method 1: Click the Open File button on the Home page to open the measurement files (*.revoMeasure files) saved in the local folder.
Method 2: Click the Open button in the navigation bar to open the measurement files (*.revoMeasure files) saved on the local folder for view or measurement.
¶ 1.2.2 Save a Project
Click the Save button in the navigation bar to save the current measurement file (*.revoMeasure files) to the local folder for view or measurement.
¶ 1.3 Export Report
The report involves the model overview, the created features, as well as the measurement and comparison results.
- Applications:
① Fully displays the model detection result, enabling users to better evaluate model's performance and quality.
② Records the detailed model detection process, allowing for easy review, and comparison between the multiple versions of detection results.
- How to export a report:
① Click the Generate Report button in the top navigation bar.
② In the pop-up window, fill in the project information, such as project name, part name, inspector, etc.
③ Select the wanted project on the right side of the window.
④ Confirm or change the save path.
⑤ Click Export to save the report as a PDF.
Reports can also be exported in JSON format to support custom development. For details, please refer to JSON Report Export and Development.
¶ 1.4 Export as Template
Create a New Template
After completing manual measurement, click “Export as Template” in the file navigation bar to save the measurement workflow as a template for reusing in future tasks.When exporting a template, you can select features and results as required.
Note:
To create a new template, a CAD/Mesh model must be imported as a reference in the current measurement.
You can add image and text annotations to each step when creating a template.
Edit Template
The current templates can only be modified within the original project before being re-exported.
① Click “Use Template” at the top of the software homepage and select the desired template to open, or double-click a template to open it.
② In the template measurement interface, click “Measurement Settings” at the top and select the files to be measured (scan file directory). Tick the "real-time monitoring files updates" option as required. This feature is particularly useful for continuous batch measurement.
When real-time monitoring is enabled, the software continuously monitors the selected folder. Newly added or updated files are automatically processed without requiring manual intervention.
Measurement files must be uploaded in the form of a folder, in which there can be one or more files to be measured.
③ Set "Auto End" feature. When the set stop conditions are met, the template measurement will automatically end.
Stop by Measurement Time:Measurement stops automatically after the specified duration.
Stop by File Count: Measurement stops automatically after the specified number of files has been processed.
④ Set the Exception handing option and the report storage location.
⑤ After completing the settings, click “Start Measurement” in the upper-left corner to begin automatic measurement.
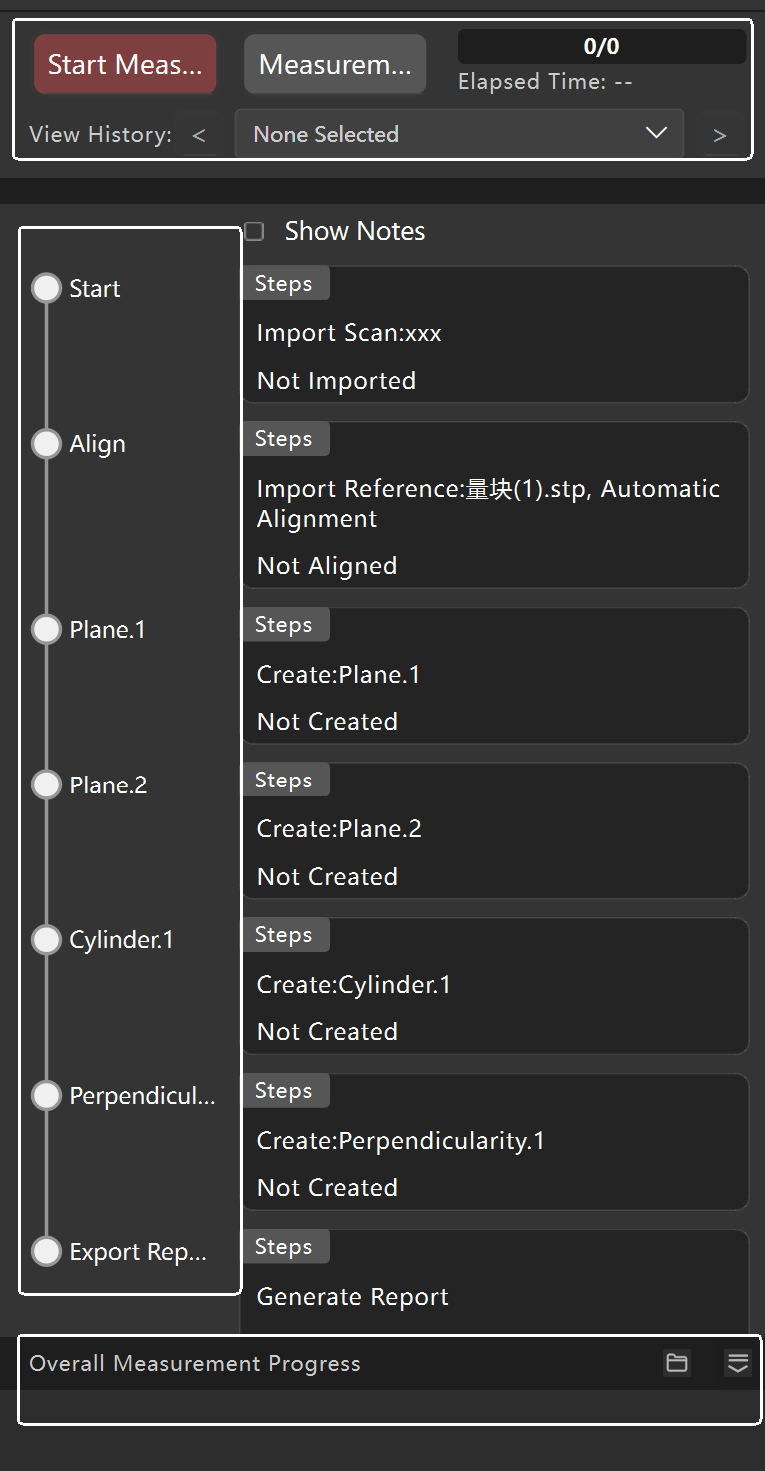
The progress bar in the left side displays the measurement progress in real time; use the History drop-down menu to review previous measurement results. You can also expand the overall progress panel below to view the completion status of the entire measurement task.
¶ 2. Measure
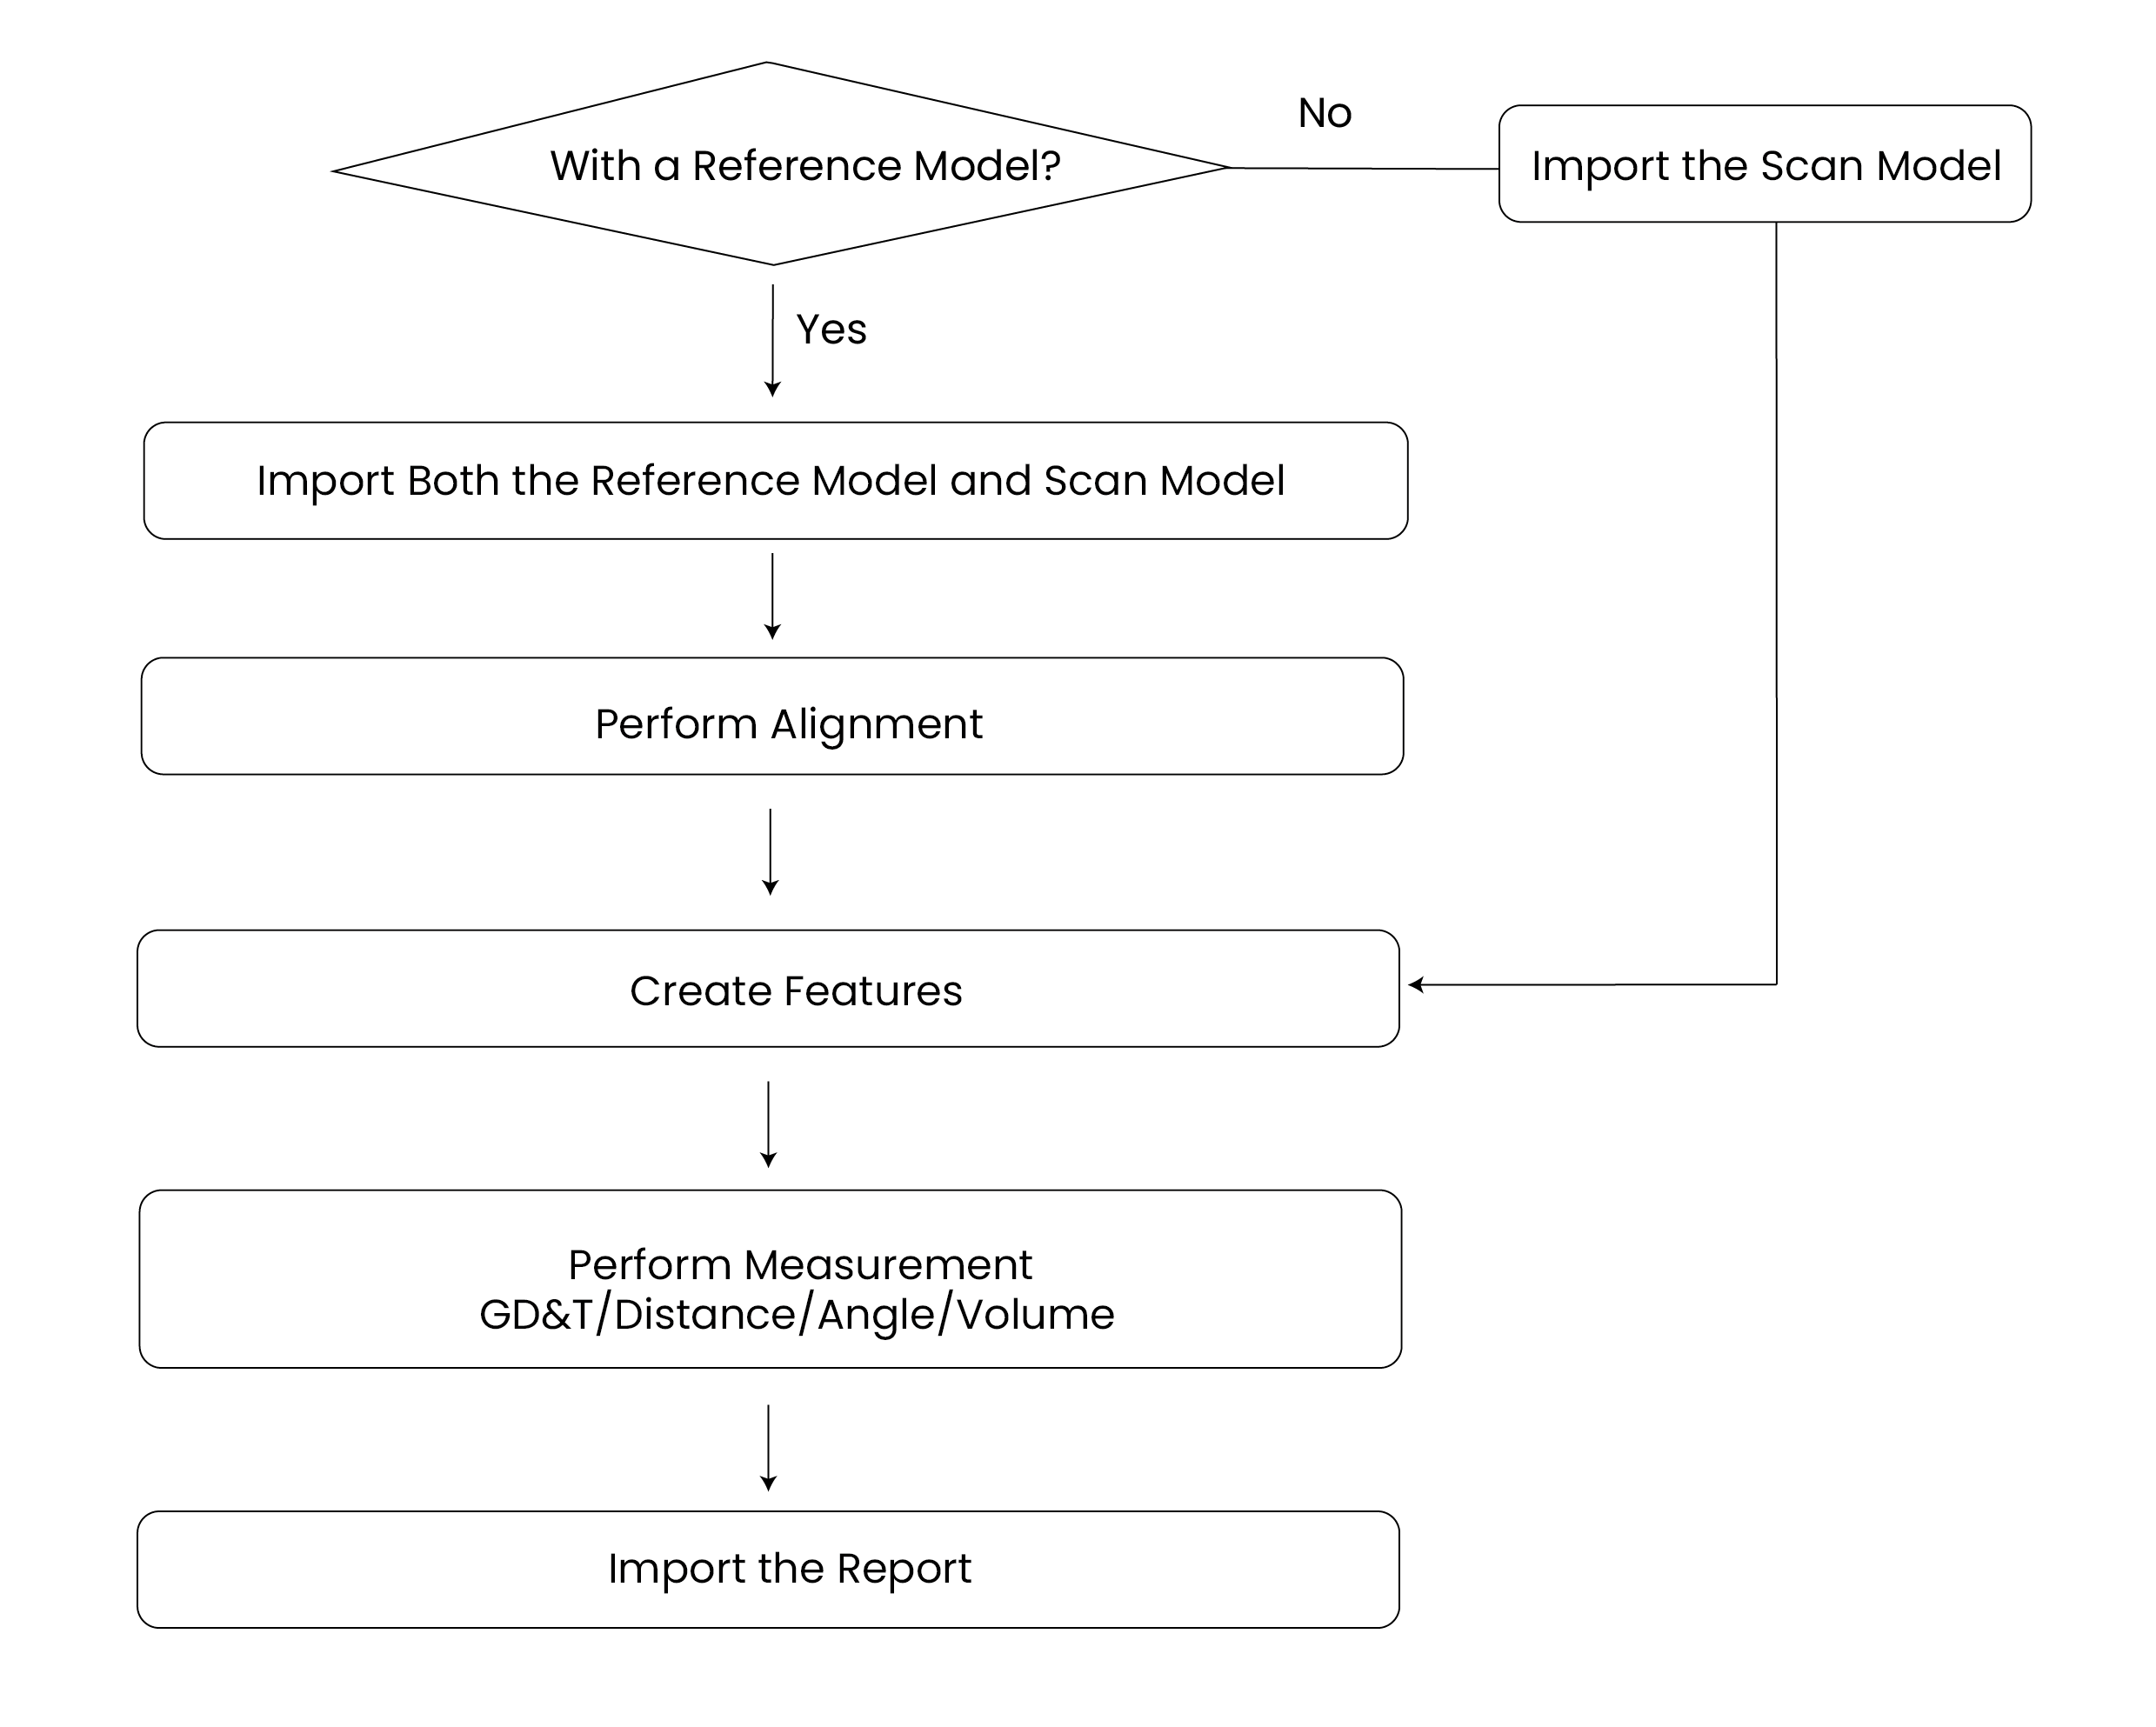
The measurement workflow is as follows:
¶ 2.1 Create Features
¶ 2.1.1 Overview
The software supports to create geometric features, such as point, straight line, plane, circle, cylinder, sphere,cone(Click to jump to the corresponding chapter).
When creating a plane feature, circle feature, cylinder feature or sphere feature, advanced settings are available to acquire more accurate results:
A parameter used to define the tolerance of the Pick-and-Fit method. After defining an approximate feature by picking points, any elements whose distance from the approximate feature exceeds the specified maximum value will be discarded to accelerate the fitting process.
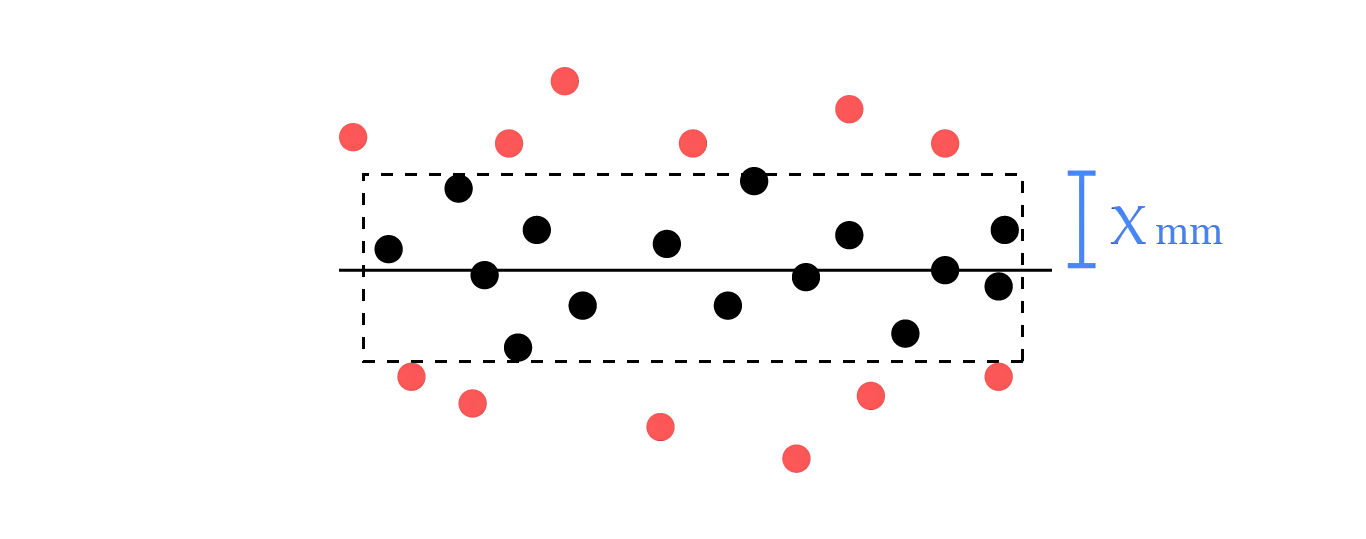
Note: In the illustration, black points are included in the fitting process, while red points are filtered out.
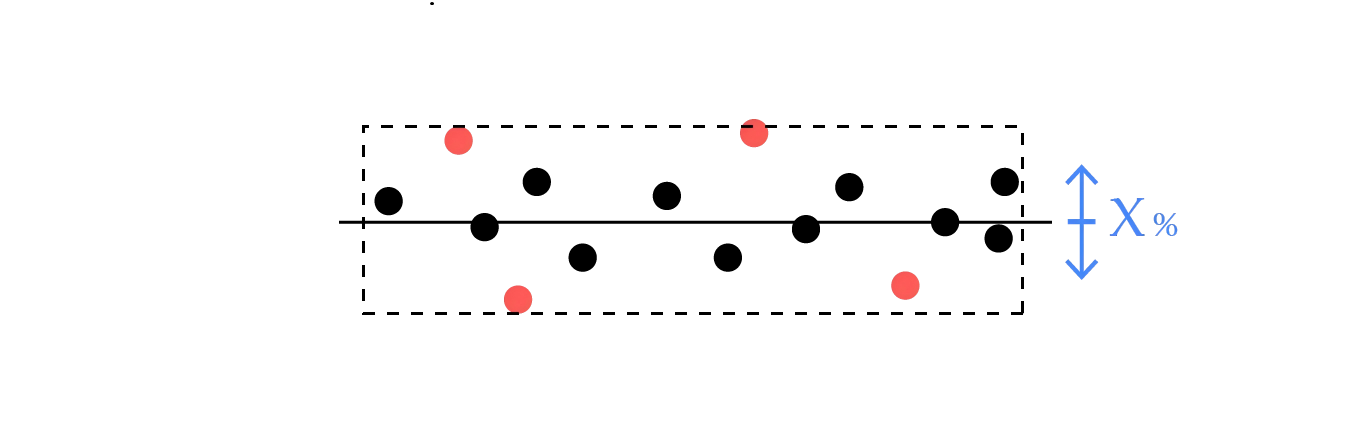
The point sampling percentage defines the proportion of scanned data retained after outlier removal. A higher value keeps more points (fewer outliers removed), while a lower value may remove too many valid data points, infuencing the fitting accuracy.
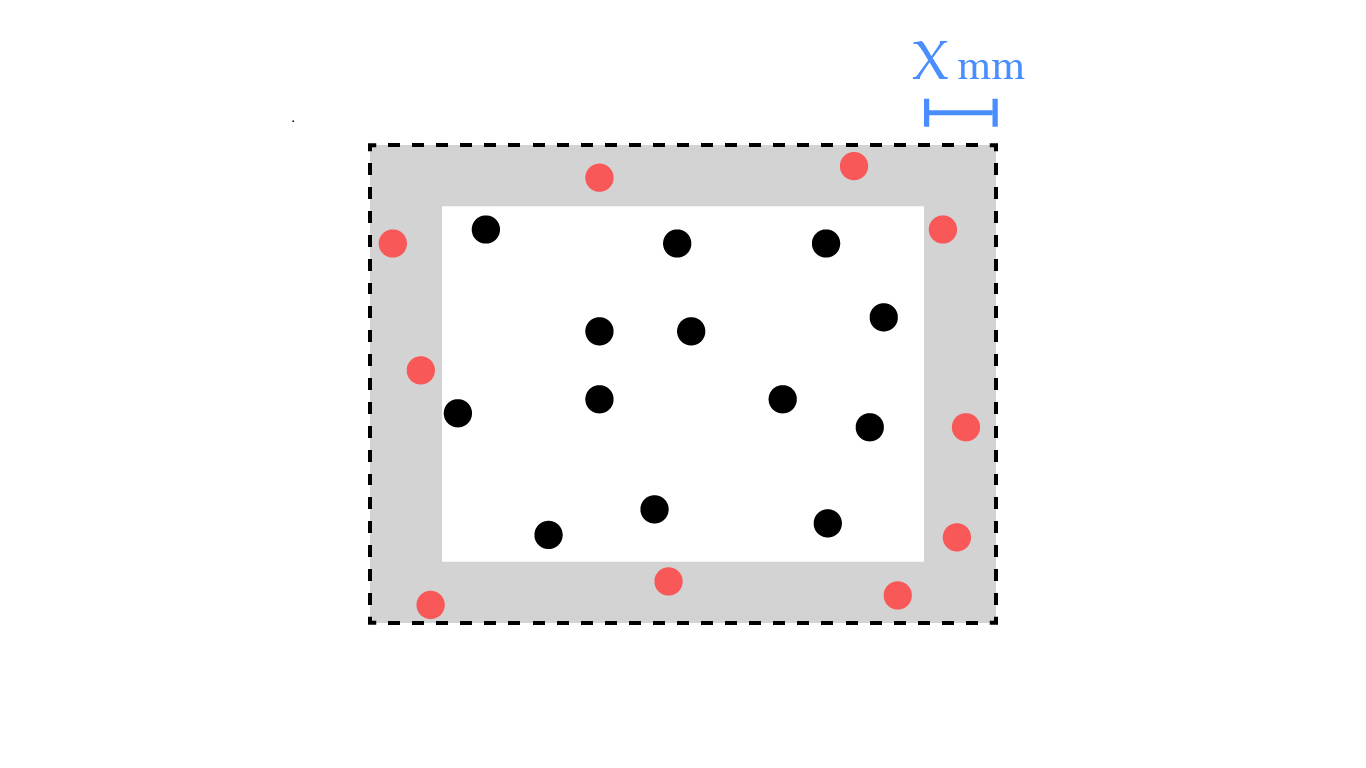
Note: In the illustration, black points represent the data included in the fitting within the boundary exclusion distance, while red points represent the data excluded from the fitting due to exceeding the distance threshold.
This parameter is used to exclude points belonging to surface regions that are irrelevant to the feature being fitted. When this parameter is enabled, the system specifies the maximum angle between the normal vector of a data point and the normal vector of the nearest feature point. This angle is used for filtering. The valid range is 0°to 180°(inclusive).
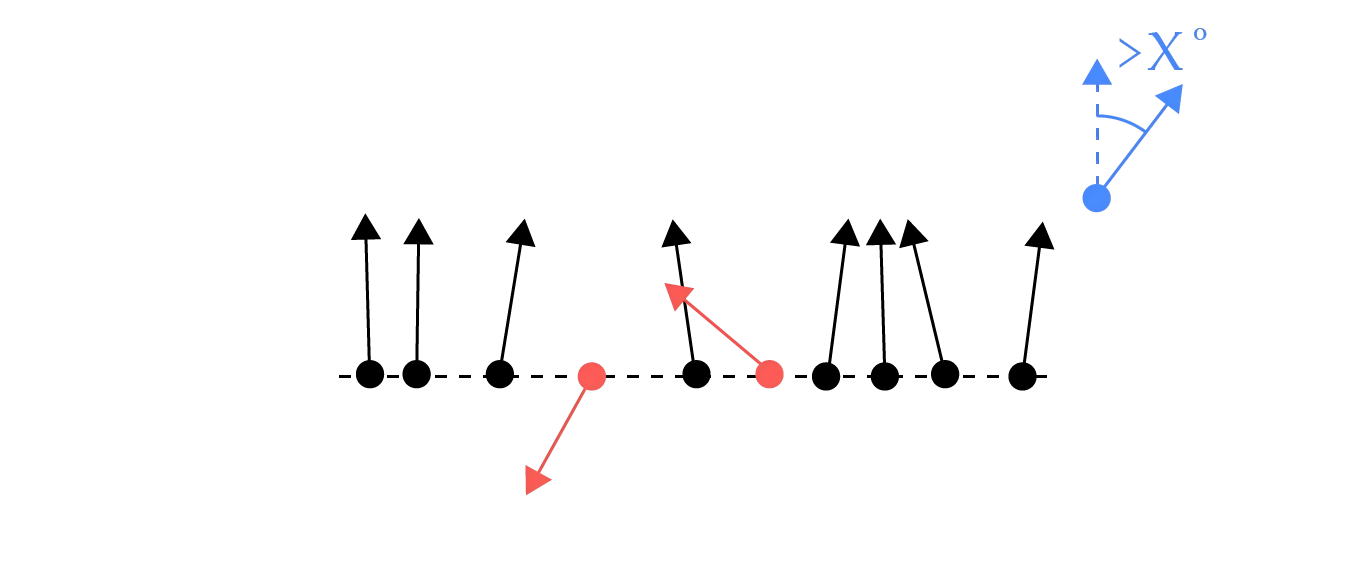
Note: In the illustration, black points are included in the fitting process, while red points are filtered out.
The point sampling percentage defines the proportion of scanned data retained after outlier removal. A higher value keeps more points (fewer outliers removed), while a lower value may remove too many valid data points, infuencing the fitting accuracy.
Note: In the illustration, black points are included in the fitting process, while red points are filtered out.
¶ 2.1.2 Point
A point feature is used to mark a certain location on the model's surface. It can only be created manually. Create it by selecting one of the following methods in Selection Mode.
Method 1: Fit by Selected Points
① Double-click a location on the model's surface to define a point.
② Click the "Create" button to complete the creation.
Method 2: Input Coordinates
① Enter the existing coordinates.
② Click the "Create" button to complete the creation.
Method 3: Auxiliary Objects
① Select a feature on the reference object. Available reference features include Circle and Sphere. Refer to the section 2.1.5/2.1.7 for how to create a circle or a sphere.
② Select the created reference feature.
③ Click the "Create" button to complete the creation.
¶ 2.1.3 Straight Line
A straight line feature is a virtual axis with direction and length. It can only be created manually. Create it by selecting one of the following methods in Selection Mode.
Applications:
① Locate the axis of the target object.
② Find the intersection line of two intersecting planes or lines.
③ Calculate the average line of two lines.
④ Inspect and measure the straightness of a line feature or axis.
Method 1: Fit by Selected Points
① Double-click and select two points on the model's surface to define a straight line.
② Click the "Create" button to complete the creation.
Method 2: Input Coordinates
① Define a straight line by entering the origin coordinates, direction, and length of the line.
② Click the "Create" button to complete the creation.
Method 3: Auxiliary Objects
Note: Ensure the needed reference features are created before using the sub methods below. Refer to the section 2.1 for how to create needed features.
Sub-method 1: Line from Angle Bisector of Coplanar Lines
① Select two coplanar auxiliary lines.
② Click the "Create" button to complete the creation.
Sub-method 2: Line from Average of Two Lines
① Select two auxiliary lines.
② Click the "Create" button to complete the creation.
Sub-method 3: Line from Two Circle Centers
① Select two auxiliary circles; the center of the circle 1 will be set as the origin.
② Click the "Create" button to complete the creation.
Sub-method 4: Line from Cylinder Axis
① Select an auxiliary cylinder.The axis of the cylinder will be created as a line feature, with the direction of the line feature along the cylinder axis.
② Click the "Create" button to complete the creation.
Sub-method 5: Line from Point Normal to Plane
① Select an auxiliary point feature and an auxiliary plane feature. Set the point as the origin, and create a line along the point normal to plane.
② Click the "Create" button to complete the creation.
Sub-method 6: Line from Intersection of Two Planes
① Select two non-parallel auxiliary planes. A line will be created along the intersection of the two planes.
② Click the "Create" button to complete the creation.
Sub-method 7: Projection Line from Line to Plane
① Select a line and a plane that are not perpendicular to each other. The projection from the line to the plane will be created as a line.
② Click the "Create" button to complete the creation.
Sub-method 8: Line from Two Point Features
① Select two point features. Then, connect the two points to create a line with its direction running from the first selected point to the second one.
② Click the "create" button to complete the creation.
¶ 2.1.4 Plane
A plane feature is a virtual plane with definite normal direction but infinite size.
Method 1: Create from CAD
① Click Import Reference and import a CAD file.
② Click Comparison to use Automatic Alignment or Manual Alignment.
③ Click the "Plane" button in the Create Feature tab bar, and move the mouse over the CAD model to define a plane.
④ Click the "Create" button to complete the creation.
Note:
The “Create from CAD” function supports one-click recognition of all features:
① Click the One-Click Feature Recognition button.
② The system automatically detects and displays all recognized features.
③ Click Create to complete batch feature creation.
Method 2: Smart Fit
① Click the "Plane" button in the Create Feature tab bar, then select Smart Fit in the Selection Mode.
② Select tools such as Brush Select,Rectangle or Lasso according to the model state.
③ Select an area on the model surface where the plane is to be fitted using the selections tools. The software will automatically extract the plane where the selected area is.
- Smart Extended Recognition: When enabled, it automatically expands the analysis from the selected data to surrounding data, fitting features based on the complete dataset. When disabled, only the selected data is used to fit features.
- Add / Delete Selection Area: Select "Add Selection Area" to continuously add selected areas; Select "Delete Selection Area" to continuously delete unwanted areas.
- Area Range: Typically used to exclude low-quality scan data at model boundaries, selecting more accurate point cloud data for feature fitting. Click "Expansion" to enlarge the selected area, or click "Contraction" to reduce the selected area.
- Expansion / Contraction Strength: Used together with Area Range. A larger strength value results in a greater expansion or contraction per operation, while a smaller value provides finer adjustments.
④ Click the "Create" button to complete the creation.
Method 3: Fit by Selected Points
① Double-click the desired locations and select 3 points to define a plane.
② Click the "Create" button to complete the creation.
Method 4: Create from Reference Mesh
① Click Import Reference to import a mesh file.
② Click Comparison, then choose Automatic Alignment or Multi-point Alignmenrt (Manual Alignment).
③ Click the "Plane" button in the Create Feature tab bar, and select "Create from Reference Mesh."
④ Select a tool such as Brush, Rectangle or Lasso based on the scan data condition.
⑤ Select the region to be fitted using the selection tool. The software will automatically fit the plane feature.
⑥ Click the "Create" button to complete the creation.
Note: This method is not available when the reference file is a CAD model.
¶ 2.1.5 Circle
A circle feature is a 2D entity defined by a center point and a radius.
Method 1: Create from CAD
① Click Import Reference to import a CAD file.
② ② Click Comparison to use Automatic Alignment or Manual Alignment.
③ Click the "Circle" button in the Create Feature tab bar, and move the mouse over the CAD model to define a circle.
④ Click the "Create" button to complete the creation.
Note:
The “Create from CAD” function supports one-click recognition of all features:
① Click the One-Click Feature Recognition button.
② The system automatically detects and displays all recognized features.
③ Click Create to complete batch feature creation.
Method 2: Smart Fit
① Click the "Circle" button in the Create Feature tab bar, then select Smart Fit in the Selection Mode.
② Select tools such as Brush Select,Rectangle or Lasso according to the model state.
③ Select an area on the model surface where the circle is to be fitted using the selections tools. The software will automatically extract the circle where the selected area is.
④ Click the "Create" button to complete the creation.
Method 3: Fit by Selected Points
① Double-click the desired locations and select 3 points to define a circle.
② Click the "Create" button to complete the creation.
Method 4: Create from Reference Mesh
① Click Import Reference to import a mesh file.
② Click Comparison, then choose Automatic Alignment or Multi-point Alignmenrt (Manual Alignment).
③ Click the "Circle" button in the Create Feature tab bar, and select "Create from Reference Mesh."
④ Select a tool such as Brush, Rectangle or Lasso based on the scan data condition.
⑤ Select the region to be fitted using the selection tool. The software will automatically fit the circle feature.
⑥ Click the "Create" button to complete the creation.
Note: This method is not available when the reference file is a CAD model.
¶ 2.1.6 Cylinder
Method 1: Create from CAD
① Click Import Reference to import a CAD file.
② Click Comparison to use Automatic Alignment or Manual Alignment.
③ Click the "Cylinder" button in the Create Feature tab bar, and move the mouse over the CAD model to define a cylinder.
④ The software will automatically extract the cylinder where the selected area is.
Note:
The “Create from CAD” function supports one-click recognition of all features:
① Click the One-Click Feature Recognition button.
② The system automatically detects and displays all recognized features.
③ Click Create to complete batch feature creation.
Method 2: Smart Fit
① Click the "Cylinder" button in the Create Feature tab bar, then select Smart Fit in the Selection Mode.
② Select tools such as Brush Select,Rectangle or Lasso according to the model state.
③ Select an area on the model surface where the cylinder is to be fitted using the selections tools. The software will automatically extract the cylinder where the selected area is.
The following parameters are available for efficiently selecting the data with the selection tools:
- Penetrate: When it is enabled, all the point cloud data along the current view direction (including the hidden data) will be selected; When disabled, only visible points are selected.
- Smart Extended Recognition: When enabled, it automatically expands the analysis from the selected data to surrounding data, fitting features based on the complete dataset. When disabled, only the selected data is used to fit features.
- Add / Delete Selection Area Select "Add Selection Area" to continuously add selected areas; Select "Delete Selection Area" to continuously delete unwanted areas.
- Area Range: Typically used to exclude low-quality scan data at model boundaries, selecting more accurate point cloud data for feature fitting. Click "Expansion" to enlarge the selected area, or click "Contraction" to reduce the selected area.
- Expansion / Contraction Strength: Used together with Area Range. A larger strength value results in a greater expansion or contraction per operation, while a smaller value provides finer adjustments.
④ Click the "Create" button to complete the creation.
Method 3: Fit by Selected Points
① Double-click the desired locations and select 4 points. The first three ones will create a circle, and the fourth one defines the cylinder's normal direction and height.
② Click the "Create" button to complete the creation.
Method 4: Input Coordinates
① Input the coordinates (x,y,z) at the cylinder's bottom center, axis direction(i,j,k), radius and height to define a cylinder.
② Click the "Create" button to complete the creation.
Method 5: Create from Reference Mesh
① Click Import Reference to import a mesh file.
② Click Comparison, then choose Automatic Alignment or Multi-point Alignmenrt (Manual Alignment).
③ Click the "Cylinder" button in the Create Feature tab bar, and select "Create from Reference Mesh."
④ Select a tool such as Brush, Rectangle or Lasso based on the scan data condition.
⑤ Select the region to be fitted using the selection tool. The software will automatically fit the cylinder feature.
⑥ Click the "Create" button to complete the creation.
Note: This method is not available when the reference file is a CAD model.
¶ 2.1.7 Sphere
Method 1: Create from CAD
① Click Import Reference to import a CAD file.
② Click Comparison to use Automatic Alignment or Manual Alignment.
③ Click the "Sphere" button in the Create Feature tab bar, and move the mouse over the CAD model to define a sphere.
④ Click the "Create" button to complete the creation.
Note:
The “Create from CAD” function supports one-click recognition of all features:
① Click the One-Click Feature Recognition button.
② The system automatically detects and displays all recognized features.
③ Click Create to complete batch feature creation.
Method 2: Smart Fit
① Click the "Sphere" button in the Create Feature tab bar, then select Smart Fit in the Selection Mode.
② Select tools such as Brush Select or Rectangle according to the model state.
③ Select an area on the model surface where the sphere is to be fitted using the selections tools. Options include Entire Sphere, Convex Hemisphere, and Concave Hemisphere. The software will automatically extract the sphere where the selected area is.
The following parameters are available for efficiently selecting the data with the selection tools:
- Penetrate: When it is enabled, all the point cloud data along the current view direction (including the hidden data) will be selected; When disabled, only visible points are selected.
- Smart Extended Recognition: When enabled, it automatically expands the analysis from the selected data to surrounding data, fitting features based on the complete dataset. When disabled, only the selected data is used to fit features.
- Add / Delete Selection Area: Select "Add Selection Area" to continuously add selected areas; Select "Delete Selection Area" to continuously delete unwanted areas.
- Area Range: Typically used to exclude low-quality scan data at model boundaries, selecting more accurate point cloud data for feature fitting. Click "Expansion" to enlarge the selected area, or click "Contraction" to reduce the selected area.
- Expansion / Contraction Strength: Used together with Area Range. A larger strength value results in a greater expansion or contraction per operation, while a smaller value provides finer adjustments.
④ Click the Create button to complete the creation.
Method 3: Fit by Selected Points
① In a 3D view, double-click a sphere's surface and select four points.
② Click the "Create" button to complete the creation.
Method 4: Create from Reference Mesh
① Click Import Reference to import a mesh file.
② Click Comparison, then choose Automatic Alignment or Multi-point Alignmenrt (Manual Alignment).
③ Click the "Sphere" button in the Create Feature tab bar, and select "Create from Reference Mesh."
④ Select a tool such as Brush, Rectangle or Lasso based on the scan data condition.
⑤ Select the region to be fitted using the selection tool. The software will automatically fit the sphere feature.
⑥ Click the "Create" button to complete the creation.
Note: This method is not available when the reference file is a CAD model.
¶ 2.1.8 Cone
Method 1: Create from CAD
① Click Import Reference to import a CAD file.
② Click Align to choose Automatic Alignment or Manual Alignment.
③ Click the "Cone" button in the Create Feature tab bar, move the cursor over the CAD model, and select the desired feature.
④ Click the "Create" button to complete the creation.
Note:
The “Create from CAD” function supports one-click recognition of all features:
① Click the One-Click Feature Recognition button.
② The system automatically detects and displays all recognized features.
③ Click Create to complete batch feature creation.
Method 2: Smart Fit
① Click the "Cone" button in the Create Feature tab bar, and select Smart Fit mode.
② Choose a selection tool (Brush, Rectangle, Lasso, etc.) based on the scan condition.
③ Select the region to be fitted; the software will automatically fit the cone feature.
Tool parameter settings available during operation:
● PenetrationWhen enabled, all point cloud data along the current view direction (including occluded points) will be selected.When disabled, only visible points are selected.
● Smart Extended RecognitionWhen enabled, the system automatically expands the selected data and fits the complete feature.When disabled, only the selected data is used for fitting.
● Selection Add / RemoveUse Add Selection to continuously include regions;Use Remove Selection to exclude unwanted regions.
● Region RangeUsed to exclude low-quality boundary data and improve fitting accuracy. Click Expand to enlarge the region, or Shrink to reduce it.
● Expand / Shrink StepControls the adjustment magnitude. Larger values result in greater changes per operation, while smaller values allow finer adjustments.
④ Click Create to complete.
Method 3: Fit by Selected Points
① In the 3D scene, double-click the target position to select four points, in which the first 3 ones are located in the bottom of the cone, and the last one represents the cone's height.
② Click Create to generate the feature.
Method 4: Create from Reference Mesh
① Click Import Reference to import a mesh file.
② Click Comparison, then choose Automatic Alignment or Multi-point Alignmenrt (Manual Alignment).
③ Click the "Cone" button in the Create Feature tab bar, and select "Create from Reference Mesh."
④ Select a tool such as Brush, Rectangle or Lasso based on the scan data condition.
⑤ Select the region to be fitted using the selection tool. The software will automatically fit the cone feature.
⑥ Click the "Create" button to complete the creation.
Note: This method is not available when the reference file is a CAD model.
¶ 2.2 GD&T
¶ 2.2.1 Overview
The GD&T (Geometric Dimensioning and Tolerancing) supports tolerance evaluation based on scan data, covering a range of features including circularity, flatness, straightness, cylindricity, concentricity, true position, parallelism, perpendicularity, angularity, circular runout, total runout (Click to jump to the corresponding chapter).
Before GD&T measurement, ensure the needed features are created.
¶ 2.2.2 Datum
In GD & T, a datum is required for all geometric tolerances (except for form tolerances) before calculation. To set a datum, select it from the dropdown menu.
How to set a datum?
① Select a feature from the object tree, and right-click to set it as a datum. Then, the corresponding node’s properties and name in the object tree will be automatically updated.
② click "Datum" in the GD&T Tab bar, select and rename the feature to be defined as a datum, then click "Create."
The datums (labeled A to Z) totalled 23. If more than 23 datums are needed in a single measurement, they should be renamed.
¶ 2.2.3 Circularity
Circularity evaluates the form deviation of a cross-sectional profile from a perfect circle.
Method 1:
Click Measurement in the top navigation bar, and select GD & T - Circularity.Then, select the desired circle using one of the following methods:
① Click the label of the desired circle in the main viewport. (coming soon)
② Click the desired circle in the object tree.
③ Select the desired circle from the dropdown menu of Feature Measurement on the right side.
After selecting the desired circle, click Measure on the right bottom corner, and the label indicating the result will appear on the selected circle.
Method 2: (coming soon)
Select the desired circle from the object tree, or select its label in the main window. Then, right-click to open the menu, and chooseGD & T - Circularity for measurement.
¶ 2.2.4 Flatness
Flatness evaluates the form deviation of a surface from an ideal plane.
Measurement Method 1:
Click Measure in the top navigation bar, and select GD & T - Flatness for measurement.
The following three ways are available to select a plane:
① Click the label of the desired plane in the main viewport. (coming soon)
② Click the desired plane feature in the object tree. (coming soon)
③ Select the desired plane from the dropdown menu of Feature Measurement on the right side.
Click Measure, and the label indicating the result will appear on the selected plane. If the target plane is not created, click Create New Feature to create it before measurement.
Measurement Method 2: (coming soon)
Select the desired plane from the object tree, or choose its label in the main window. Then, right-click to open the menu, and select GD&T - Flatness for measurement.
¶ 2.2.5 Straightness
Straightness evaluates the form deviation of a line feature or an axis feature.
Straightness measurement is applied to the fitted lines or the lines extracted from the cylinder axis.
Measurement Method 1:
Click Measure in the top navigation bar, and select GD & T - Straightness for measurement.
The following three ways are available to select a straight line: When selecting a cylinder, the measured line is the line along with the cylinder's axis.
① Click the labels of the desired straight line or cylinder in the main viewport. (coming soon)
② Click the desired straight line or cylinder in the object tree. (coming soon)
③ Select the straight line or cylinder from the dropdown menu of Feature Measurement on the right side. (coming soon)
Note: When selecting a cylindrical feature, the measured line is the axis extracted from the cylinder.
Click Measure, and the label indicating the result will appear on the selected straight line. If the target straight line is not created, click Create New Feature to create it before measurement.
Measurement Method 2: (coming soon)
Select the desired straight line from the object tree, or choose its label in the main window. Then, right-click to open the menu, and select GD&T - Straightness for measurement.
¶ 2.2.6 Cylindricity
Cylindricity evaluates the form deviation of a cylindrical surface from a perfect cylinder.
Measurement Method 1:
Click Measure in the top navigation bar, and select GD & T - Cylindricity for measurement.
The following three ways are available to select a cylinder:
① Click the label of the desired cylinder in the main viewport. (coming soon)
② Click the target cylinder from the object tree. (coming soon)
③ Select the target cylinder from the dropdown menu of Feature Measurement on the right side.
Click Measure, and the label indicating the result will appear on the selected cylinder. If the target cylinder is not created, click Create New Feature to create it before measurement.
Measurement Method 2: (coming soon)
Select the target cylinder from the object tree, or choose its label in the main window. Then, right-click and choose GD & T - Cylindricity for measurement.
¶ 2.2.7 Concentricity
Concentricity describes the deviation of a feature’s central axis or center point from being perfectly aligned with a specified datum.
Concentricity measurement is applicable to:
① The feature with a center point, like a circle or a sphere.
② The feature with a central axis, like a cylinder.
When selecting the feature with a central axis, concentricity is also referred to as coaxiality.
The concentricity measurement is also based on a datum. Being concentric or coaxial with the measured object, the established datum should not be a point or a sphere. For example, when measuring a feature's coaxiality, the selected datum should also be a feature with a central axis. Refer to Section 2.2.2 for how to set up a datum.
Measurement Method 1:
Click Measure in the top navigation bar, and select GD & T - Concentricity for measurement.
The following three ways are available to select the feature to be measured:
① Click the labels of the desired circle, sphere, or cylinder in the main viewport. (coming soon)
② Click the desired circle, sphere, or cylinder in the object tree. (coming soon)
③ Select the desired feature from the dropdown menu of Feature Measurement on the right side.
Select the existing datum from the datum selection dropdown list. If the datum is not created, refer to Section 2.2.2 to create it in the object tree.
Click Measure, and the label indicating th result will appear on the selected feature. If the desired feature or datum is not created, click Create New Feature to create it before measurement.
Measurement Method 2: (coming soon)
Select the desired feature from the object tree, or select its label in the main window. Then, right-click to open the menu, and select GD & T - Concentricity for measurement.
Select the existing datum from the datum selection dropdown list. If the datum is not created, refer to Section 2.2.2 to set it up in the object tree.
¶ 2.2.8 True Position
True Position is used to describe the positional deviation of a feature from a datum.
The True Position measurement is based on one or more datums. Refer to Section 2.2.2 for how to set up a datum.
Measurement Method 1:
Click Measure in the top navigation bar, and select GD & T - True Position for measurement.
There are three ways to select a measured feature:
① Click the label of the desired feature in the main viewport. (coming soon)
② Click the target feature in the object tree. (coming soon)
③ Select the desired feature from the dropdown menu of Feature Measurement on the right side.
Select the existing datum from the datum selection dropdown list. If the datum is not created, refer to Section 2.2.2 to set it up in the object tree.
Click Measure, and the label indicating True Position result will appear on the selected feature. If the desired feature or datum is not created, click Create New Feature to create it before measurement.
Measurement Method 2: (coming soon)
Select the desired feature from the object tree, or select its label in the main window. Then, right-click to open the menu, and select GD & T - True Position for measurement.
Select the existing datum from the datum selection dropdown list. If the datum is not created, refer to Section 2.2.2 to set it up in the object tree.
¶ 2.2.9 Parallelism
Parallelism is used to describe the deviation in the parallel relationship between a feature and a specified datum plane or datum axis.
Parallelism measurement applies to several types of feature combinations, such as plane-to-plane, plane-to-line, line-to-plane, and line-to-line, in which the "plane" includes plane and circle features, and the "line" includes straight lines and cylinder axes. Parallelism measurement is based on a datum. Refer to Section 2.2.2 for how to set up a datum.
Note: The feature and the datum for parallelism measurement must be in a parallel relationship; otherwise, parallelism cannot be measured.
Measurement Method 1:
Click Measure in the top navigation bar, and select GD & T - Parallelism for measurement.
There are three ways to select a measured feature:
① Click the label of the desired feature in the main viewport. (coming soon)
② Click the desired feature in the object tree. (coming soon)
③ Select the desired feature from the dropdown menu of Feature Measurement on the right side.
Select the existing datum from the datum selection dropdown list. If the datum is not created, refer to Section 2.2.2 to set it up in the object tree.
Click Measure, and the label indicating Parallelism result will appear on the selected feature. If the desired feature or datum is not created, click Create New Feature to create it before measurement.
Measurement Method 2: (coming soon)
Select the desired feature from the object tree, or select its label in the main window. Then, right-click to open the menu, and select GD & T - Parallelism for measurement.
Select the existing datum from the datum selection dropdown list. If the datum is not created, refer to Section 2.2.2 to set it up in the object tree.
¶ 2.2.10 Perpendicularity
Perpendicularity is used to describe the deviation in the perpendicular relationship between a feature and a specified datum plane or axis.
Perpendicularity measurement applies to several types of feature combinations, such as plane-to-plane, plane-to-line, line-to-plane, and line-to-line, in which the "plane" includes plane and circle, and the "line" includes straight lines and cylinder axes. Perpendicularity measurement is based on a datum. Refer to Section 2.2.2 for how to set up a datum.
Note: The feature and the datum for perpendicularity measurement must be in a perpendicular relationship. Otherwise, perpendicularity cannot be measured.
Measurement Method 1:
Click Measure in the top navigation bar, and select GD & T - Perpendicularity for measurement.
There are three ways to select the measured feature:
① Click the label of the desired feature in the main viewport. (coming soon)
② Click the desired feature in the object tree. (coming soon)
③ Select the desired feature from the dropdown menu of Feature Measurement on the right side.
Select the existing datum from the datum selection dropdown list. If the datum is not created, refer to Section 2.2.2 to set it up in the object tree.
Click Measure, and the label indicating Perpendicularity result will appear on the selected feature. If the desired feature or datum is not created, click Create New Feature to create it before measurement.
Measurement Method 2: (coming soon)
Select the desired feature from the object tree, or select its label in the main window. Then, right-click to open the menu, and select GD & T - Perpendicularity for measurement.
Select the existing datum from the datum selection dropdown list. If the datum is not created, refer to Section 2.2.2 to set it up in the object tree.
¶ 2.2.11 Angularity
Angularity is used to describe the deviation of a feature from a specified datum when the relationship is at a specified angle (0° < θ < 90°).
Angularity measurement applies to several types of feature combinations, such as plane-to-plane, plane-to-line, line-to-plane, and line-to-line, in which the "plane" includes plane and circle, and the "line" includes straight lines and cylinder axes. Angularity measurement is based on a datum. Refer to Section 2.2.2 for how to set up a datum.
Measurement Method 1:
Click Measure in the top navigation bar, and select GD & T - Angularity for measurement.
There are three ways to select the measured feature:
① Click the label of the desired feature in the main viewport. (coming soon)
② Click the desired feature in the object tree. (coming soon)
③ Select the desired feature from the dropdown menu of Feature Measurement on the right side.
Select the existing datum from the datum selection dropdown list. If the datum is not created, refer to Section 2.2.2 to set it up in the object tree.
Manually set the angle value (or acquire the value from the CAD model), click Measure, and the label indicating Angularity result will appear on the selected feature. If the desired feature or datum is not created, click Create New Feature to create it before measurement.
Measurement Method 2: (coming soon)
Select the desired feature from the object tree, or select its label in the main window. Then, right-click to open the menu, and select GD & T - Angularity for measurement.
Select the existing datum from the datum selection dropdown list. If the datum is not created, refer to Section 2.2.2 to set it up in the object tree.
¶ 2.2.12 Circular Runout
Circular runout indicates how much the feature's surface cross sections can deviate from the perfect circles formed when the part is rotated 360° around the datum axis.
Currently, circular runout measurement only applies to the circle features on the exposed end of a cylinder's surface.
Circular Runout measurement is based on a datum. Refer to Section 2.2.2 for how to set up a datum.
The datum can be a cylinder or a line generated from the axis of the cylinder. When selecting a cylinder feature, its axis is used as the datum.
Measurement Method 1:
Click Measure in the top navigation bar, and select GD & T - Circular Runout. Select Radial or axial on the right side for measurement.
There are three ways to select the measured feature:
① Click the label of the desired feature in the main viewport. (coming soon)
② Click the desired feature in the object tree. (coming soon)
③ Select the desired feature from the dropdown menu of Feature Measurement on the right side.
Select the existing datum from the datum selection dropdown list. If the datum is not created, refer to Section 2.2.2 to set it up in the object tree.
Click Measure, and the label indicating Circular Runout result will appear on the selected feature. If the desired feature or datum is not created, click Create New Feature to create it before measurement.
Measurement Method 2: (coming soon)
Select the desired feature from the object tree, or select its label in the main window. Then, right-click to open the menu, and select GD & T - Circular Runout for measurement.
Select the existing datum from the datum selection dropdown list. If the datum is not created, refer to Section 2.2.2 to set it up in the object tree.
¶ 2.2.13 Total Runout
Total Runout is how much one entire feature or surface varies with respect to a datum when the part is rotated 360° around the datum axis. It includes radial and axial total runout. The total runout measurement only applies to cylinder features.
Total Runout measurement is based on a datum. Refer to Section 2.2.2 for how to set up a datum.
The datum can be a cylinder or a line generated from the axis of the cylinder. When selecting a cylinder feature, its axis is used as the datum.
Measurement Method 1:
Click Measure in the top navigation bar, and select GD & T - Total Runout. Select Radial or axial on the right side for measurement.
There are three ways to select the measured feature:
① Click the label of the desired feature in the main viewport. (coming soon)
② Click the desired feature in the object tree. (coming soon)
③ Select the desired feature from the dropdown menu of Feature Measurement on the right side.
Select the existing datum from the datum selection dropdown list. If the datum is not created, refer to Section 2.2.2 to set it up in the object tree.
Click Measure, and the label indicating Total Runout result will appear on the selected feature. If the desired feature or datum is not created, click Create New Feature to create it before measurement.
Measurement Method 2: (coming soon)
Select the desired feature from the object tree, or select its label in the main window. Then, right-click to open the menu, and select GD & T - Total Runout for measurement.
Select the existing datum from the datum selection dropdown list. If the datum is not created, refer to Section 2.2.2 to set it up in the object tree.
¶ 2.3 Basic Measurement
¶ 2.3.1 Distance Measurement
Measures the distance between the selected features.
Distance measurement applies to various types of geometric features, including point-to-point, point-to-line, line-to-line, line-to-plane, and plane-to-plane.
If only scan data is available, the measurement result is presented as the actual value derived from the scan data.
If reference data is available and aligned with the scan data, the measurement results are presented as reference distance, the scanned distance, and the deviation between the two.
Tolerance constraints can also be applied to the deviation results.
¶ 2.3.1.1 Point to Point
Measures the distance from point to point.
Point-to-point distances not only applies to two points, but also to two circle centers or two sphere centers.
Note:The distance defaults to be measured in three dimensions (X-direction, Y-direction, and Z-direction).
¶ 2.3.1.2 Point to Line
Measures the perpendicular distance from a point to its extended line.
Available point features include: point, circle (center), and sphere (center).
Available line features include: line and cylinder (axis).
Note:The distance defaults to be measured in three dimensions (X-direction, Y-direction, and Z-direction).
¶ 2.3.1.3 Line to Line
Measures the spatial distance between two lines.
When the lines are skew (non-coplanar), the distance is the length of the segment perpendicular to both lines.
When the lines are coplanar, the distance is the length of a perpendicular from the midpoint of object 1 to the extended line of object 2.
The line-to-line distance measurement is only applicable to line features. If the axis measurement for a solid feature is required, create the axis as a line feature first.
Some quick operations are supported: For example, when the cylinder axis measurement is required, select a cylinder feature.
Note:The distance defaults to be measured in three dimensions (X-direction, Y-direction, and Z-direction).
¶ 2.3.1.4 Line to Plane
Measures the distance from the midpoint of a line to an infinite plane.
When the midpoint of the line lies on the plane (or the line lies on the plane), the distance is 0.
¶ 2.3.1.5 Plane to Plane
Measures the distance between two parallel planes.
If the planes are unparallel, the distance is 0.
The plane-to-plane distance measurement is only applicable to plane features. If the measurement for a solid feature's surface is required, create the surface as a plane feature first.
¶ 2.3.2 Angle Measurement
Measures the angle between the selected features.
Angle Measurement is applicable to line-to-line, line-to-plane, and plane-to-plane.
Available line features include: line and cylinder (axis).
Available plane feature is plane.
¶ 2.3.2.1 Line to Line
Measures the angle between two lines. The software will automatically project the feature 1 to the feature 2 by moving feature 1's parallel line to feature 2's coplane, and the included angle is calculated as the line to line angle.
¶ 2.3.2.2 Line to Plane
Measures the angle between a line to a plane. Calculate the angle between their normal vectors, and the complementary angle is the measurement result.
¶ 2.3.2.3 Plane to Plane
Measures the angle between two planes. Calculate the angle between their normal vectors, and the acute angle or right angle is the measurement result.
¶ 2.3.3 Volume Measurement
Measures the overall volume of the scanning model(meshed model).
Steps:
① In the Basic Measurement tab, select Volume.
② Choose Overall Volume.
③ Click "Calculate", and the result will appear in both the label and the object tree.
Notes:
It should be a meshed model. If the model isn't selected through, the result displays the volume of the bounding box.
The volume calculation of a non-watertight model is for reference only.
¶ 2.4 Create Section
¶ 2.4.1 Section Measurement
Measure geometric dimensions directly on a cross-sectional profile to obtain accurate section-based measurement results.
Supports importing scan files/reference files.
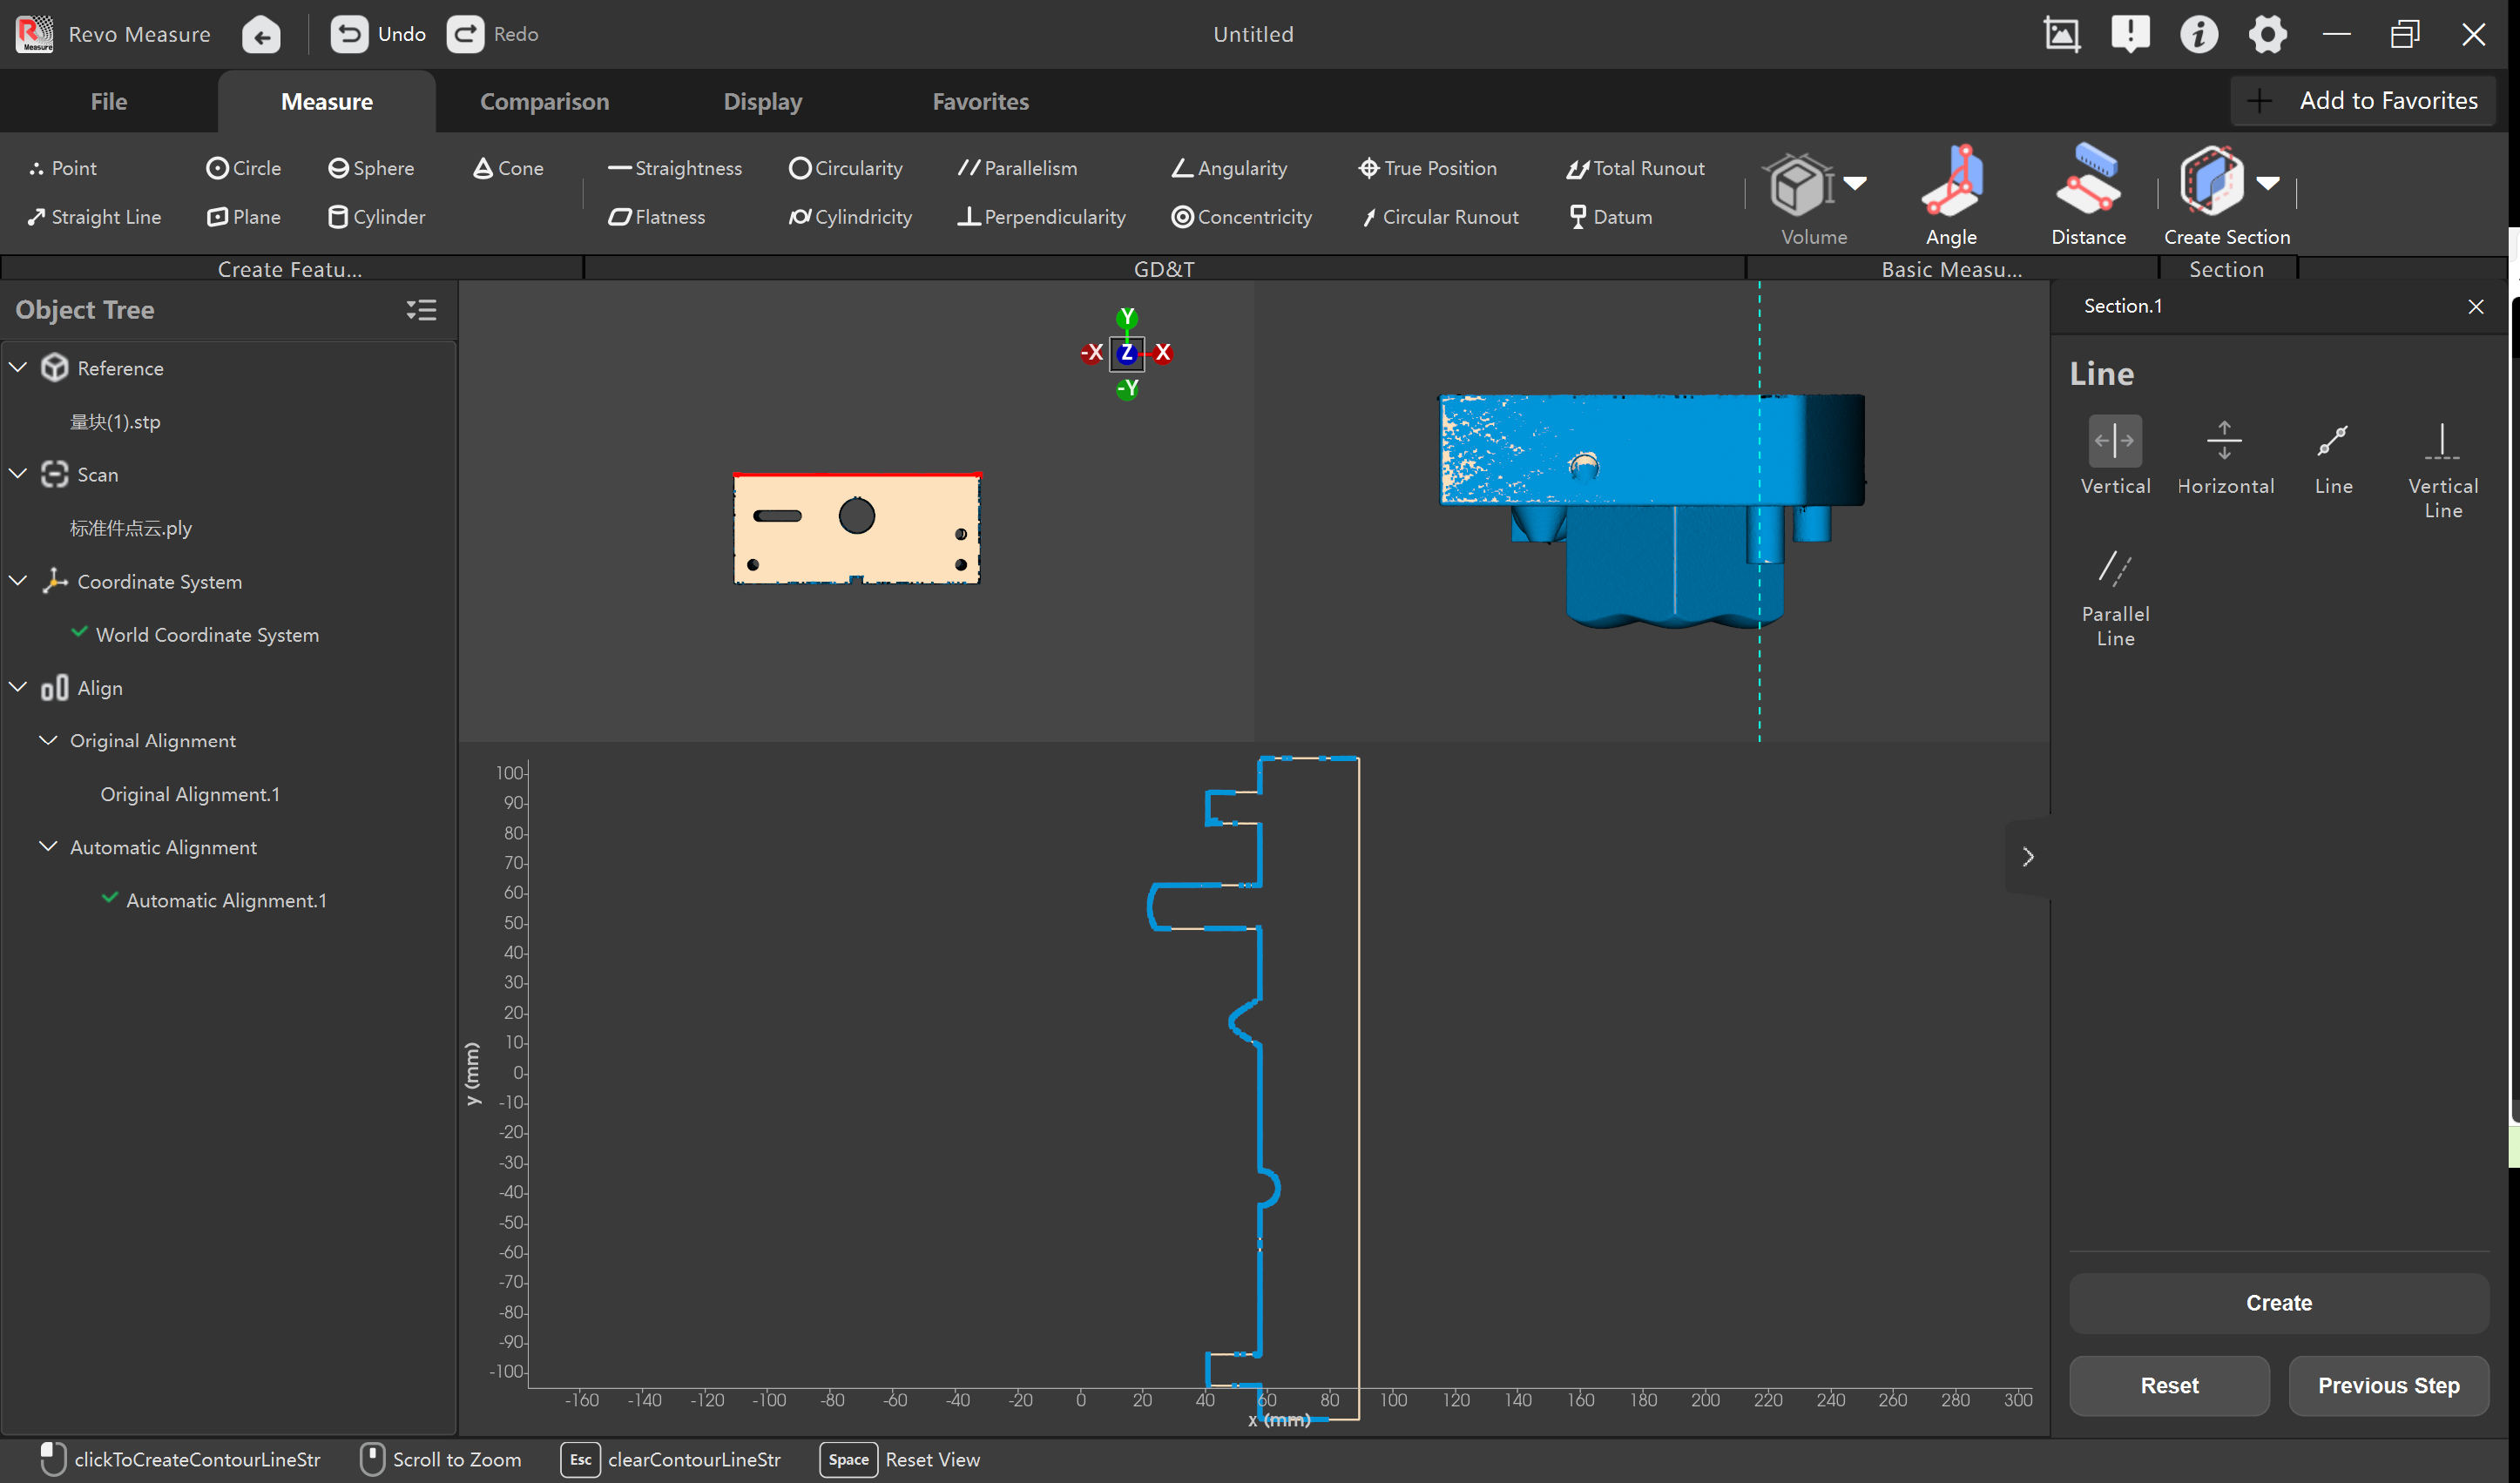
① After entering Section Measurement, the interface is divided into three viewports:
Upper Left: 3D View Upper Right: 2D Section View Bottom: Extracted Cross-Section View
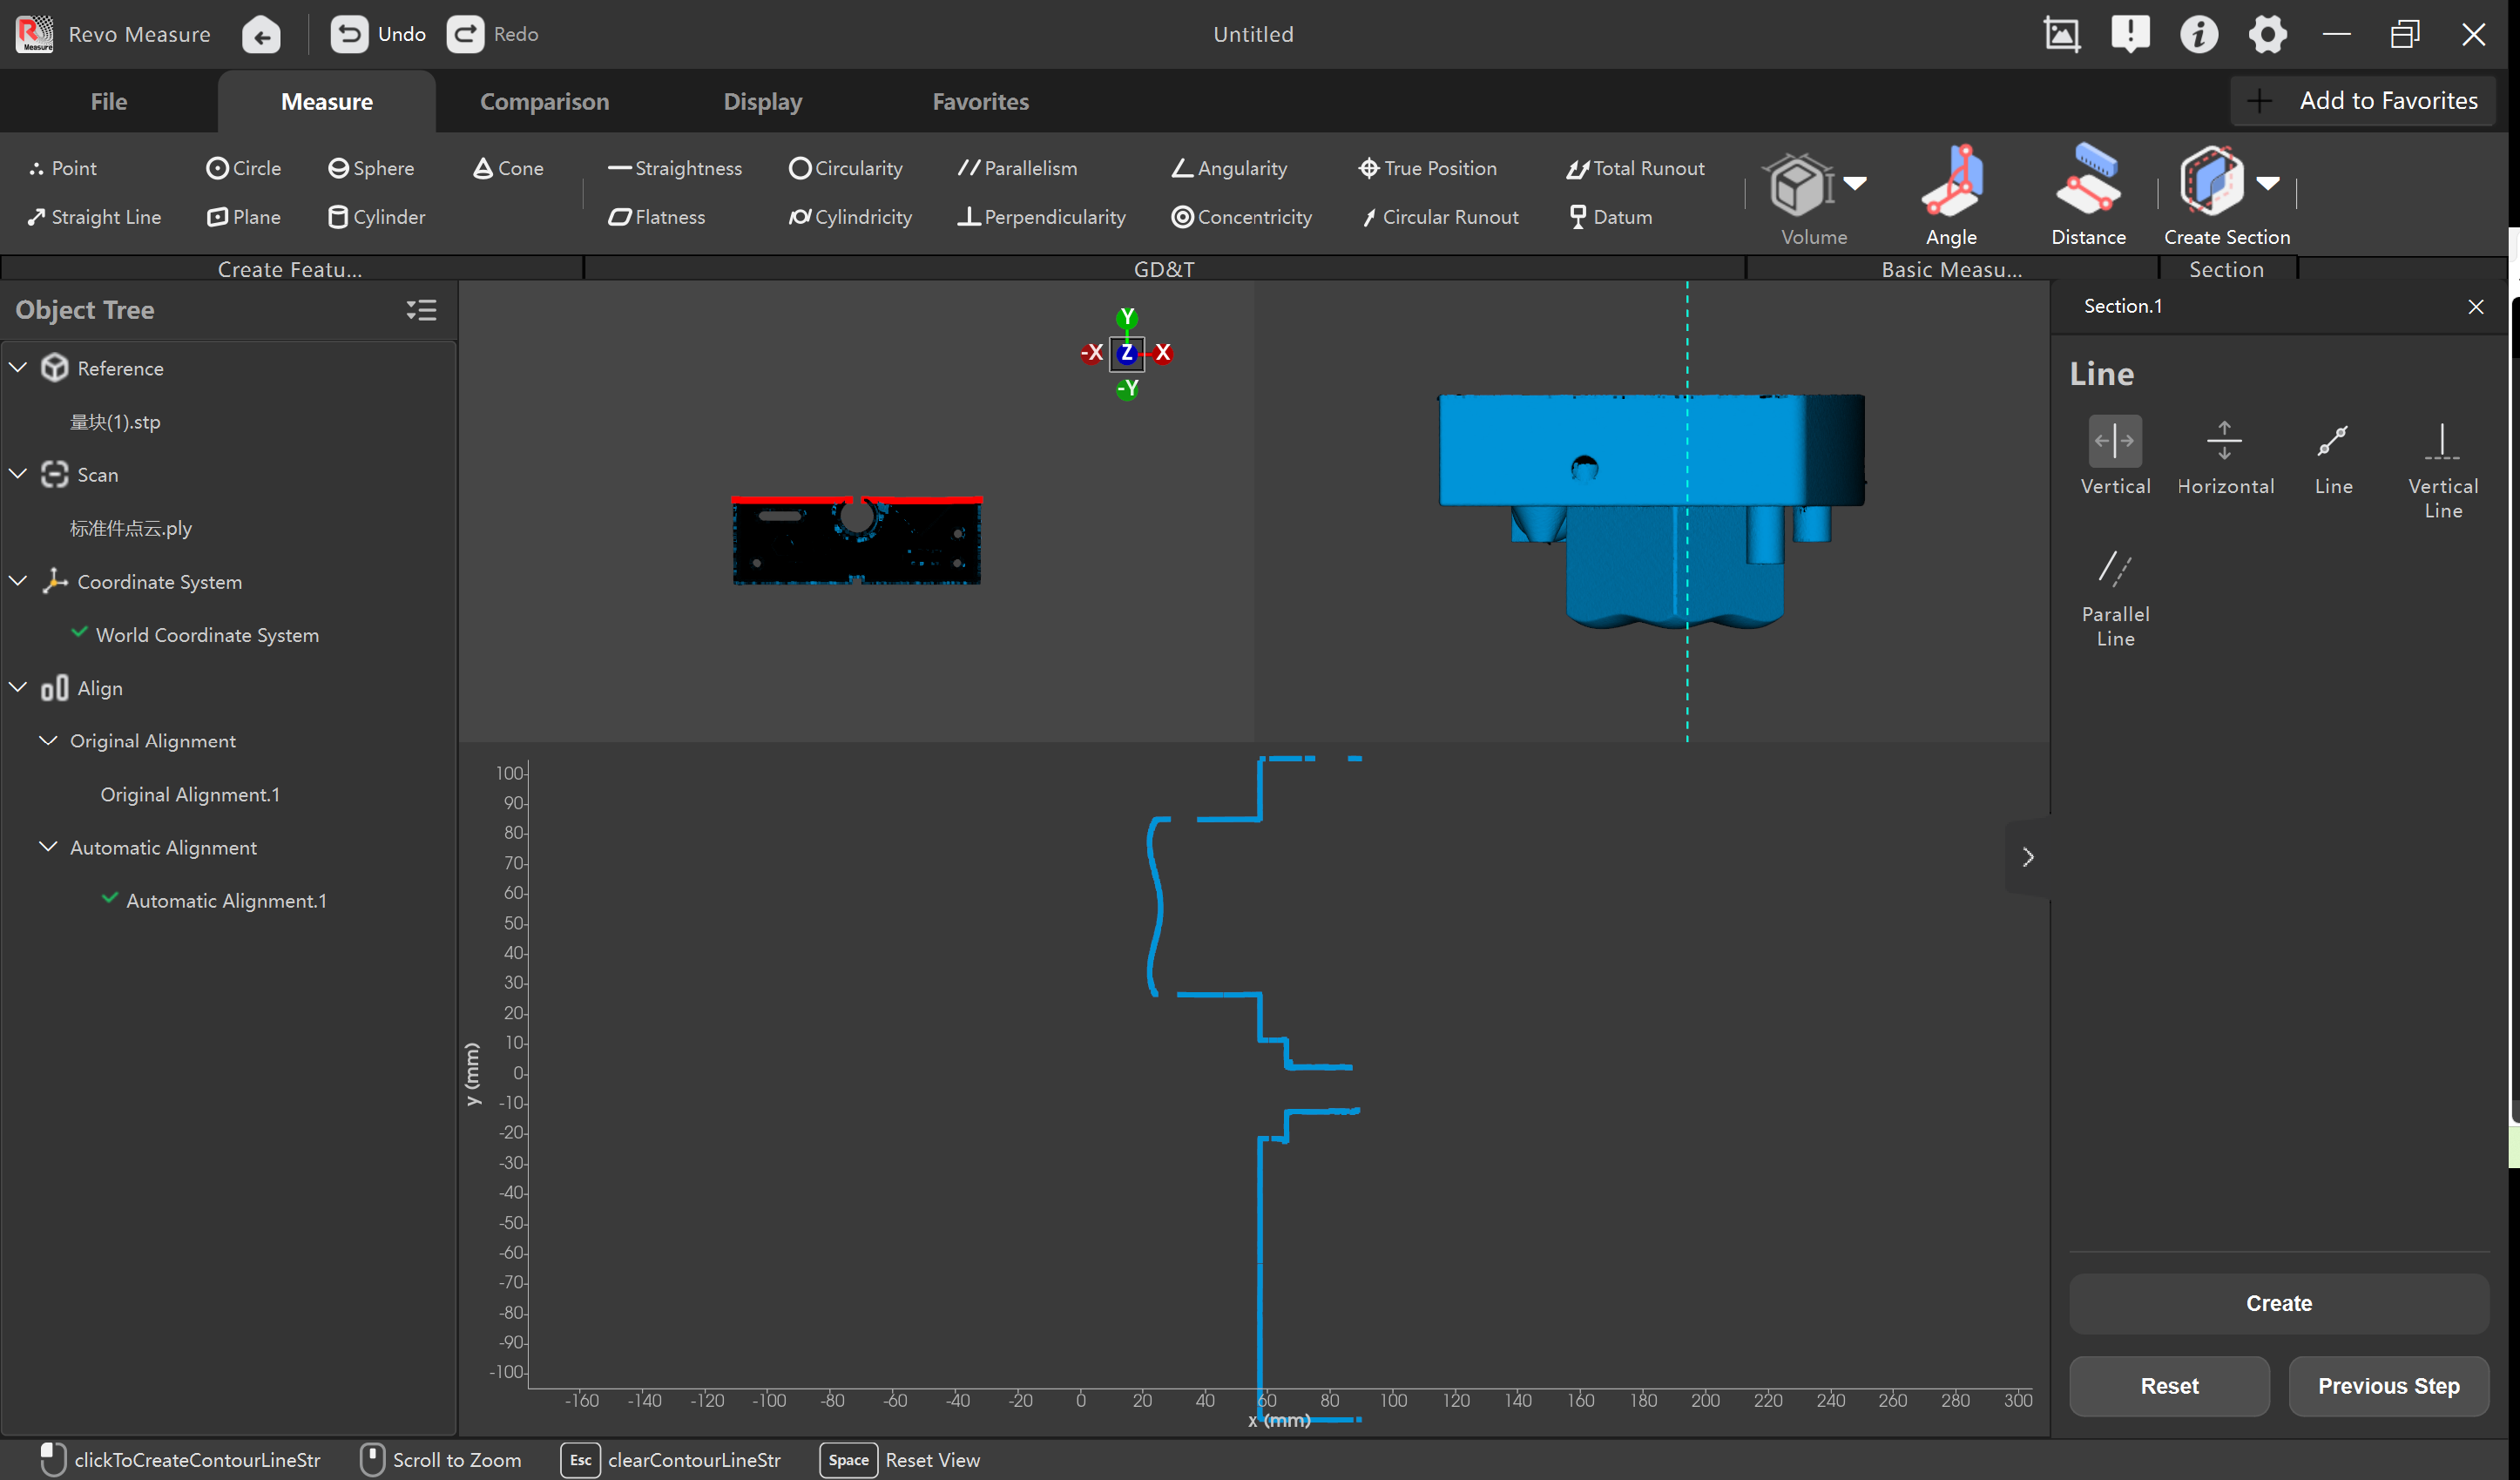
② Select a Reference Plane: Use either a coordinate system or an existing feature as the reference plane to orient the upper-right 2D view and define the location and measurement direction of the cross section.
Note: When using a feature as the datum plane, a plane feature must be created beforehand.
③ Create a Section: Choose a sectioning method.As the cursor moves within the 2D section view, profile guides are displayed to assist with section placement. Available sectioning methods include:
- Vertical:Creates a section using a vertical line in the 2D view.
- Horizontal:Creates a section using a horizontal line in the 2D view.
- Line:Creates a section along an arbitrary line.(Select any two points in the 2D view to define the line.)
- Vertical Line:Creates a section perpendicular to a user-defined line.(The reference line is created in the same manner as the Line method.)
- Parallel Line:Creates a section parallel to a user-defined line. (The reference line is created in the same manner as the Line method.)
Click the left mouse button to confirm the section position, then click "Create."
④ Perform Measurements: Select the required measurement data. The following measurement tools are available:
- Point-to-Point: Measures the distance between two points. Including: Minimum Distance/Vertical Distance/Horizontal Distance.
- Point-to-Line:Measures the perpendicular distance from a point to a line.
- Line-to-Line:Measures the straight-line distance between the midpoint of the first line and the second line.
- Point-to-Circle:Measures the distance from a point to the center of a circle. Including: Minimum Distance/Vertical Distance/Horizontal Distance.
- Circle-to-Line:Measures the perpendicular distance from a circle center to a line.
- Circle-to-Circle:Measures the distance between the centers of two circles. Including: Minimum Distance/Vertical Distance/Horizontal Distance.
- Angle:Measures the included angle between two lines.
- Arc Radius (R):Measures the radius of a selected arc segment.
- Corner Radius (R):Measures the fillet radius at a profile transition.
- Diameter:Measures the diameter of a circular feature.
- Circumference:Measures the circumference of a circular profile.
- Thickness:Measures the perpendicular distance between two parallel or near-parallel profile segments.
¶ 2.4.2 Reference Section Comparison
Compare a measured cross section against a reference section to evaluate dimensional deviations and profile accuracy. Both scan data and reference data must be imported and aligned before comparison.
① Import the scan model and reference model, then perform alignment.
② After entering Section Measurement, the interface is divided into three viewports:
Upper Left: 3D View Upper Right: 2D Section View Bottom: Extracted Cross-Section View
③ Select a Reference Plane: Use either a coordinate system or an existing feature as the reference plane to orient the upper-right 2D view and define the location and measurement direction of the cross section.
Note: When using a feature as the datum plane, a plane feature must be created beforehand.
④ Create a Section: Choose a sectioning method.As the cursor moves within the 2D section view, profile guides are displayed to assist with section placement. Available sectioning methods include:
- Vertical:Creates a section using a vertical line in the 2D view.
- Horizontal:Creates a section using a horizontal line in the 2D view.
- Line:Creates a section along an arbitrary line.(Select any two points in the 2D view to define the line.)
- Vertical Line:Creates a section perpendicular to a user-defined line.(The reference line is created in the same manner as the Line method.)
- Parallel Line:Creates a section parallel to a user-defined line. (The reference line is created in the same manner as the Line method.)
Click the left mouse button to confirm the section position, then click "Create."
⑤ The software overlays the measured cross-sectional profile and the reference cross-sectional profile in the bottom viewport and displays them in different colors for easy comparison of deviations.
Measured Cross Section: Blue
Reference Cross Section: Yellow
When the two profiles closely overlap, the deviation in that area is minimal. If a noticeable separation appears between the profiles, it indicates a larger deviation or deformation in that region.
⑥ Section measurements can also be performed in Reference Section Comparison. The following measurement tools are available:
- Point-to-Point: Measures the distance between two points. Including: Minimum Distance/Vertical Distance/Horizontal Distance.
- Point-to-Line:Measures the perpendicular distance from a point to a line.
- Line-to-Line:Measures the straight-line distance between the midpoint of the first line and the second line.
- Angle:Measures the included angle between two lines.
Note: When selecting a measurement region on the cross section, you can choose whether to measure the scan data or the reference data.
¶ 3. Comparison
¶ 3.1 Alignment
¶ 3.1.1 Automatic Alignment
The software provides automatic alignment between models. When reference data is imported, the alignment will be performed automatically.
Automatic alignment applies to feature-rich objects. Repeat the operation until getting a better result.
Automatic alignment is not available to models with no normal, which needs to be aligned via Multi-point Alignment.
Follow the steps below if an alignment is required in other scenarios:
① Ensure both the reference data and scan data have been imported.
② Click Comparison in the navigation bar, and select Automatic Alignment.
¶ 3.1.2 Multi-point Alignment
The multi-point alignment is fit for the scenario where the object features are hard to be identified by automatic alignment.
Steps:
① Ensure both the reference model and scan model have been imported.
② Click Comparison in the navigation bar,and select Multi-point Alignment.
③ Select at least 3 pairs of points on the same locations of the two models. Note that the 3 pairs of points should be located on multiple surfaces.
④ In the operation panel on the right side, check the number of the points on the two models and how they are matched.
⑤ Click the Align button at the bottom of the right panel to complete alignment.
Note: For more accurate alignment, it is recommended to select points on multiple surfaces (e.g., front, back, and side), particularly vertices or edge points.
¶ 3.1.3 3-2-1 Alignment
3-2-1 Alignment aligns a model by manually selecting corresponding features from the scan data and reference data and establishing coordinate constraints through three groups of matching features.
The following feature types are required for 3-2-1 Alignment:
Plane: Plane
Axis: Cylinder, Cone
Center Point: Circle, Sphere, Point
3-2-1 Alignment supports the following six feature sequence modes: Plane – Axis – Point/Plane – Point – Axis/Axis – Plane – Point/Axis – Point – Plane/Point – Plane – Axis/Point – Axis – Plane.
The software prioritizes alignment according to the selected sequence. The alignment requirement of the first feature group is satisfied first, followed by the second group and then the third group. As a result, different feature sequences may produce different alignment results.
① Make sure that both reference data and scan data have been imported.
② Click Comparison in the navigation bar and select 3-2-1 Alignment to enter the alignment page.
③ Select a feature sequence. The default sequence is: Plane – Axis – Center Point.
④ For each of the three feature groups, select the corresponding source feature and target feature from the drop-down lists.
- Scan features are selected from the scan model.
- Reference features are selected from the CAD model.
If the required alignment features have not been created, click the "+" button next to the drop-down list to create them.
[Create and select features in the following order]:
First Feature Group (Plane):
Create Plane 1 on the scan model using Smart Fit, and create Plane 2 on the CAD model.
Second Feature Group (Axis):
Create Cylinder 1/Cone 1 on the scan model using Smart Fit, and create Cylinder 2/Cone 2 on the CAD model.
Note:Cone features are recommended because their axis direction is uniquely defined. When using cylinder features, ensure that the cylinder axis directions on the CAD model and scan model are consistent; otherwise, alignment accuracy may be affected.
Third Feature Group (Center Point):
Create Circle 1/Sphere 1/Point 1 on the scan model using Smart Fit, and create Circle 2/Sphere 2/Point 2 on the CAD model.
Note: When creating a point feature, select a location on the model boundary.
⑤ Click "OK" in the lower-right corner to complete the alignment.
¶ 3.2 Deviation Analysis
Deviation analysis is generally used for deformation analysis during the manufacturing process. The software supports both Overall Deviation and Point DeviationAnalysis.
¶ 3.2.1 Overall Deviation
Overall deviation aims to analyze the deviation between the scan model and the reference model by projecting all paired points on the scan model to the reference model. The result will be rendered as color map on the scan model, helping analyze both positive and negative deviations across the entire model. The color map supports to set the tolerance range and its colors, providing clearer deviation analysis results.
Steps:
① Ensure both the reference data and scan data have been imported and aligned.
② Click Comparison, then select Overall Deviation, and click Create.
Once calculation is complete, the result is displayed as a deviation color map on the scan model.
You can change the upper and lower limits of the color bar in the property page. Any deviation values beyond the limits will display the color of the limits.
¶ 3.2.2 Point Deviation
Point deviation is typically used to analyze deviations at specific points between the reference and scan data, helping control the key areas of the model.
Steps:
① Ensure both the reference model and scan model have been imported and aligned.
② Click Comparison,select Overall Deviation and calculate.
③ After calculating the overall deviation, select Point Deviation.
④ Each time a point is selected, its color and deviation label will be displayed.
Note:
A point can be selected by following three methods:
● Double-click to manually select a point
● Enter specific point coordinates on the model
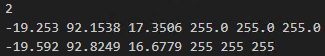
● Import *.csv file format
The CSV file must contain three coordinate values (X, Y, and Z) on each row, and these coordinates must be consistent with the coordinate system and units used in the current project/data. For example:
⑤ By default, the color of the deviation label header is the same with the deviation result color which can be found in the color bar.
Additionally, Point Deviation can also be performed based on the Whole Deviation analysis.
¶ 3.3 Create Coordinate System
A coordinate system can be created by defining the origin and axis directions to establish a measurement reference frame shared by point cloud data, CAD models, and measurement results.
The following coordinate system creation methods are supported:
| Creation Method | Description |
| Numeric Creation | Define a coordinate system by entering numerical values directly (the origin and the directions of any two axes among X, Y, and Z). |
| Feature Creation | Define a coordinate system using existing features. |
| Translation and Rotation | Define a coordinate system by applying translation and rotation transformations. |
¶ 3.3.1 Numeric Creation
① Click Comparison > Create Coordinate System in the navigation bar, then select Numeric Creation as the creation method.
② Enter the coordinates of the desired origin and specify the directions of any two axes among X, Y, and Z.
③ Click "Create" to generate the coordinate system.
¶ 3.3.2 Feature Creation
The software can create a coordinate system by selecting geometric features on the part. Depending on the selected feature type, the software extracts a Normal vector (plane), axis vector (cylinder/cone), or direction vector (straight line) as the coordinate axis direction. The center of the first selected feature is used as the coordinate system origin.
❖ Without Specifying an Origin:
To create a coordinate system, select two directional features(planes/cylinders/cones/lines) in sequence under First and Second.
- The direction vector of the first selected feature defines the Z-axis, and its feature center is automatically used as the coordinate system origin.
- The direction vector of the second selected feature defines the X-axis.
Note: The selected normal vectors and axis vectors must be perpendicular to each other.
❖ With a Specified Origin:
The origin of the coordinate system is determined by the center of the first selected feature, while the axis directions are defined by the features selected afterward.
① If the first selected feature is a plane, cylinder, cone, or line:
These feature types provide both a direction vector and a feature center. Only the First and Second selections are required.
- First: Defines the Z-axis using the direction vector and sets the feature center as the origin.
- Second: Defines the X-axis using the direction vector.
② If the first selected feature is a circle or sphere:
Circle and sphere features provide only a center point and do not contain directional information. Additional feature selections are required to define the axis directions.
- First:First: Uses the circle center or sphere center as the coordinate system origin.
- Second: Defines the Z-axis using the direction vector.
- Third: Defines the X-axis using the direction vector.
Note: The selected normal vectors and axis vectors must be perpendicular to each other.
¶ 3.3.3 Translation and Rotation
① Click Comparison > Create Coordinate System in the navigation bar, then select Translation and Rotation as the creation method.
② Based on an existing coordinate system, enter the desired translation values or rotation angles.
③ Click "Create" to generate the coordinate system.
¶ 4. Display
¶ 4.1 Render and Display
The Display option in the navigation bar offers multiple rendering modes for viewing meshed and CAD models, as well as various model display states.
¶ 4.1.1 Scan
Switch between the rendering modes of the mesh model in the viewport.
Three rendering modes are available: wireframe rendering, mesh rendering, vertex rendering.
Supports texture rendering and displaying and allows importing the texture files acquired by Revopoint scanners for viewing.
¶ 4.1.2 CAD
Switch between the rendering modes of the CAD model. The software offers three rendering modes: Solid Rendering, Wireframe Rendering, and Solid Wireframe Rendering.
¶ 4.2 View
¶ 4.2.1 Fit to View
Automatically zooms the view to fit the size of the model window, centering and optimally displaying all models.
¶ 4.2.2 Initial Pose
Reset the model to the initial location and pose when it's imported.
¶ 5.Feedback
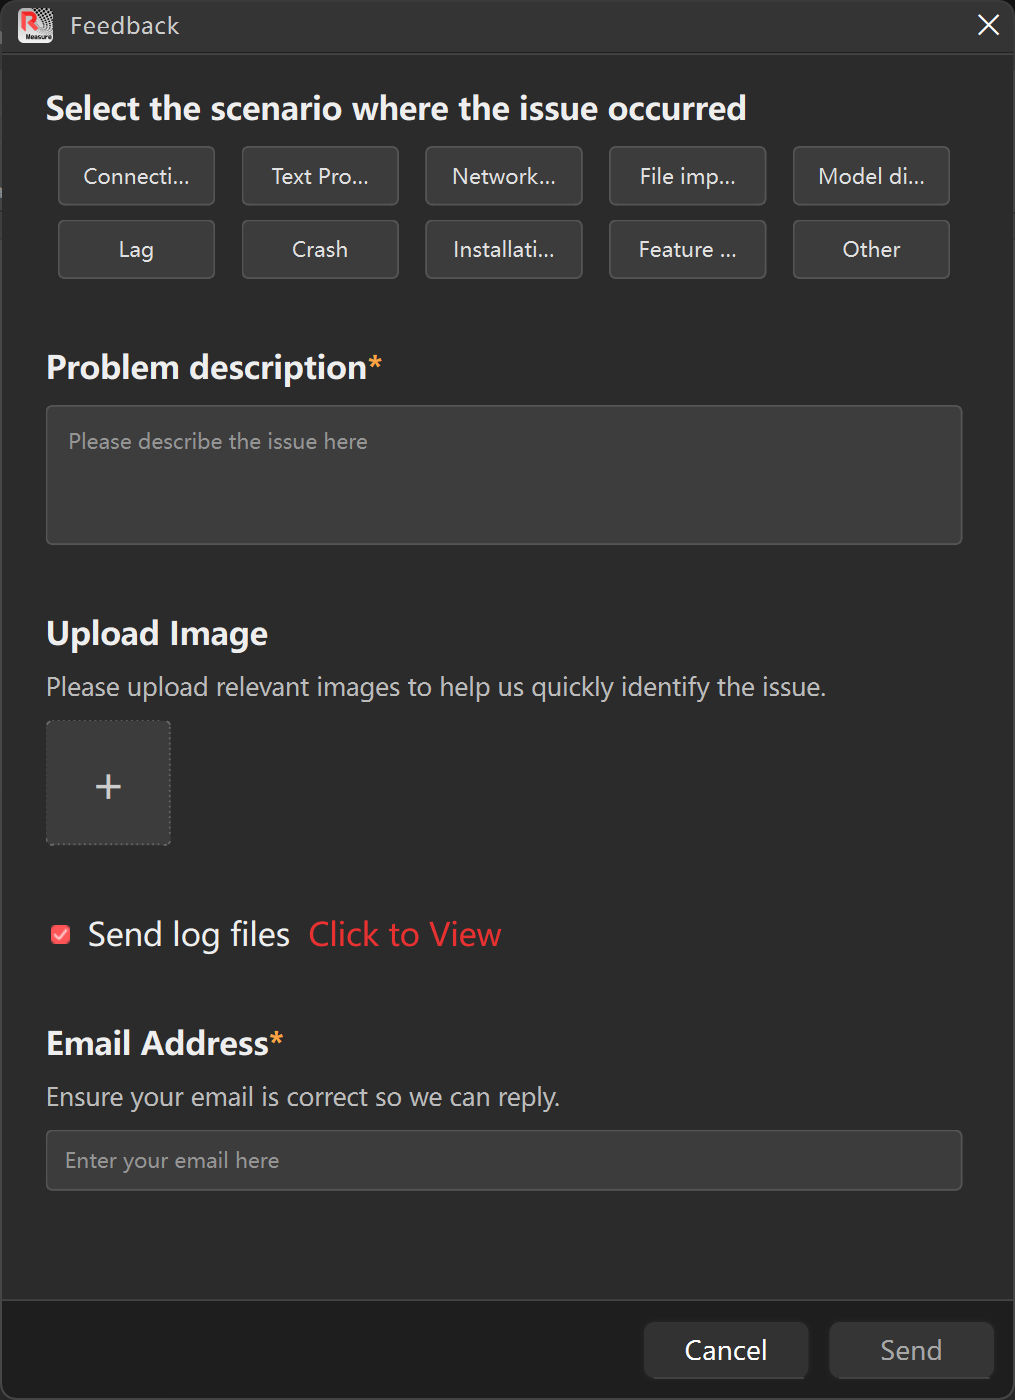
① Click the  in the upper-right corner of the software to open the feedback page.
② Enter the required information and provide a valid email address. If necessary, select "Send log files" to help the support team analyze the issue more accurately.
After the feedback is submitted, the support team will contact you via email and assist in resolving the issue.
¶ 6. Shortcut Keys
¶ 6.1 Shortcut Keys
Multi-select: Hold Shift and click on multiple objects. Applicable in both the Object Tree and the Viewport.
Delete: Press the Delete key to delete the selected objects.
Move: Drag the mouse wheel. Or hold Shift key, and drag with the left mouse button.
Rotate: Hold the Ctrl key to rotate the model.
cancel: Esc
Zoom in/Zoom out the brush diameter: Hold the Ctrl key and scroll the mouse wheel.
Undo/Redo: Ctrl + Z/Ctrl + Y
¶ 6.2 Shortcut Operation
① Click the Screenshot button in the upper-right corner of the software  to capture a selected area of the current interface. After the screenshot is saved, it will be displayed at the bottom of the Object Tree on the left side of the interface.
② In the Object Tree or Viewport, right-click a single selected feature to open a context menu. You can perform related operations, including Set as Datum, View Feature Properties, GD&T, Rename, Delete, Show/Hide, or Focus in Viewport.
③ Select two features in the Object Tree, right-click to open the context menu. You can perform operations on both objects, including Measurement, GD&T, Delete, and Show/Hide.
④ Select multiple features or results in the Object Tree, right-click to open the context menu. You can perform batch operations such as Delete and Show/Hide.
⑤ Select multiple features or results in the Viewport, right-click to open the context menu. You can perform batch operations such as Delete and Show/Hide.
¶ 7. Glossary
| Measurement | GD&T | Geometric Dimensioning and Tolerancing |
| Straightness | The form error of a straight line feature or an axis feature. | |
| Flatness | The form error of a plane feature. | |
| Roundness | The form error of a circle feature and its cross-sectional circle. | |
| Cylindricity | The form error of a cylinder feature. | |
| Surface Profile | Deviation between an actual surface feature and its theoretically correct geometric shape. | |
| Parallelism | Error in the parallel relationship between a feature and a specified datum plane or axis. | |
| Perpendicularity | Error in the perpendicular relationship between a feature and a specified datum plane or axis. | |
| Angularity | Error in the angular relationship (0°<θ<90°) between a feature and the specified datum plane or axis. | |
| Concentricity | The concentricity or coaxiality error between a circle or axis feature and the specified datum. | |
| Symmetry | The deviation between the centers of two features and the datum center plane or center axis. | |
| True Position | The positional error of a feature relative to a datum. | |
| Circular Runout | Error between the cross-section of a cylindrical or conical feature and the ideal circle formed with respect to its datum axis. | |
| Radial Runout | Error between the surface of a cylindrical or conical feature and the ideal rotational surface formed with respect to its datum axis. | |
| Distance | Measures the length distance between two points or features. | |
| Angle | Measures the angular dimension between two features. | |
| Radial | Measurements or dimensions taken along the radius of a circle or cylinder feature. | |
| Surface Area | Measures the surface area of the specified feature or the selected region. | |
| Volume | Measures the overall volume of the meshed model. | |
| Create Section | Create a cross-section | |
| Thickness | Measures the thickness at various positions of the entire model. | |
| Comparison | Import Reference | Import reference files for comparison. Both meshed models and CAD models can be imported. |
| Flip Normals | Invert the overall surface normals of the CAD model. | |
| Mirror | Set the datum plane as the center of mirroring to generate a CAD model symmetrical to the datum plane, which will serve as new reference data. | |
| Automatic Alignment | Automatically overlay more scan data onto the reference data and align them using a best-fit algorithm. | |
| Multi-Point Alignment | Align the scan data with the reference data by manually selecting multiple corresponding points on both models. | |
| Datum Alignment | Align the scan data to the reference data by registering geometric feature groups. Typically used for further optimization after automatic alignment. | |
| Feature Alignment | Align the scan data to the reference data by registering the centers of geometric features or surface points. Typically used for further optimization after automatic alignment. | |
| 3-2-1 Alignment | Align the scan data to the reference data by registering a combination of planes, axes, and points. Typically used for further optimization after automatic alignment. | |
| Overall Deviation | Measure the overall deviation between the reference data and the scan data. The deviation results are presented in the form of a color map. | |
| Point Deviation | Measure the deviation at specified points and display the deviation values with a color map. | |
| Sectional Deviation | Measure the deviation of the created sections, presenting the results with a color map. | |
| Boundary Deviation | Measure the boundary line position deviation between the reference data and the scan data, displaying the results with a color map. This function is applicable only to thin-walled workpieces. | |
| Show/Hide Deviation Color Map | Show or hide the current measurement deviation color map. | |
| Deviation Map Settings | Customize parameters such as the map colors and value range. | |
| Feature Creation | Free Creation | Quickly create multiple features on a CAD model through identifying and selecting them. |
| Circle | Create a circle feature | |
| Point | Create a point feature | |
| Cylinder | Create a cylinder feature | |
| Plane | Create a plane feature | |
| Line | Create a line feature | |
| Sphere | Create a sphere feature | |
| File | Import Reference | Import reference files for comparison. Both meshed models and CAD models can be imported. |
| Import Scan | Import a scan file to start measurement. Both point cloud models and meshed models can be imported. | |
| New | Start a new measurement | |
| Open | Open the measurement file saved on the local drive | |
| Save | Save the current measurement file on the local drive | |
| Generate Report | Generate and save the measurement report on the local drive | |
| Export as Template | Save the current measurement process as a template | |
| Display | Mesh Rendering | Render a mesh model's polygons |
| Wireframe Rendering | Render a mesh model's wireframe | |
| Vertices Rendering | Render a mesh model's vertices | |
| Texture Rendering | Display a mesh model's texture | |
| Solid Rendering | Render CAD solids | |
| Solid Wireframe Rendering | Render CAD solids and wireframe | |
| Wireframe Rendering | Render a CAD model's wireframe | |
| Fit to View | Zoom the model to fit in the main view window | |
| Initial Pose | Reset the model to the initial location and pose when imported | |
| Orthographic View | Switch the model to orthographic view | |
| Show Selected Only | Display only the selected object's labels in the main view window | |
| Auto Arrange | Automatically arrange the positions of all labels in the main view window | |
| Other | Overall Deviation | Comprehensive evaluation of deviations between all measurement points in the scan model and the CAD model. Click the "Create" button to automatically generate results. Results will be displayed as a color map. After generating the overall deviation, use the point deviation function to view deviation data at specific locations. |
| CAD Creation | Move the mouse over the CAD model and click the desired features. Click "Create" to quickly create a feature. | |
| Point Deviation | Double-click to display the point deviation of the selected point. Continuous selection is supported. Click "Complete" to save all the deviation values. Double-click the point deviation option in the object tree or view it in the exported report. |
|
| Datum Setting | The specified feature for measurement reference. Right-click a feature in the object tree and select "Set as Datum" to define it as the datum feature. |